
Graph of Trigonometric Function
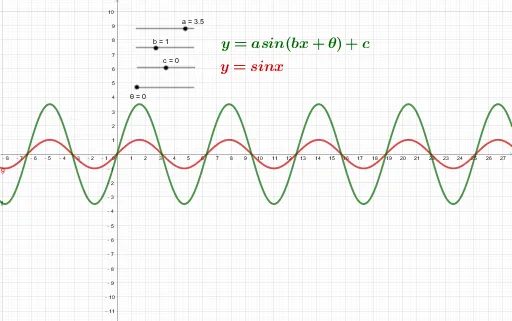
This example demonstrates the graph of the trigonometric function y=asin(bx+θ)+c. It involves the core mathematical concepts of trigonometric functions, function dilation, and translation. The construction points include using GeoGebra commands objects a, b, c, text1, g, θ, f, text2. It is suitable for middle school or high school math classrooms, used to display the graph and properties of trigonometric functions.
Loading the math board and drawing, please wait…