
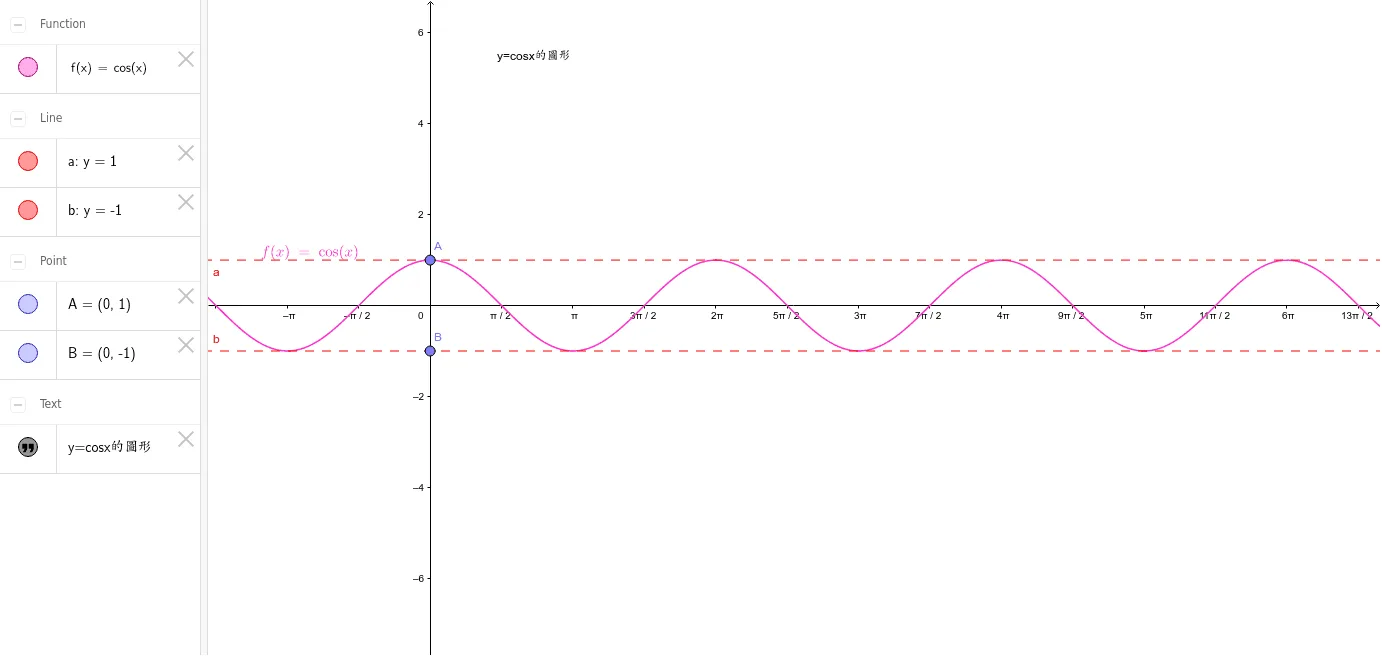
Graph of Cosine Function y = cos(x) with Geometric Construction
This GeoGebra example demonstrates the standard graph of the cosine function y = cos(x) in a Cartesian coordinate system, visually illustrating its periodicity, symmetry, and range through dynamic geometry. The core mathematical concepts include the definition of cosine, the relationship between the unit circle and trigonometric lines, transformations of function graphs, and connections between functions and geometric objects such as rectangles and line segments. Construction highlights: using the Point command to create key points (e.g., moving points A and B on the curve), the OrthogonalLine command to draw perpendicular lines that help relate function values to coordinate axes, and a text object (text1) to label the function or important information. The final construction integrates the cosine curve, auxiliary lines, and geometric elements. This resource is suitable for high school students learning trigonometric graphs and properties, as well as for introductory calculus courses, helping learners bridge geometric intuition and algebraic representation.
Loading the math board and drawing, please wait…