
Graph of a Quadratic Function by Almar Alvarado
Loading the math board and drawing, please wait…
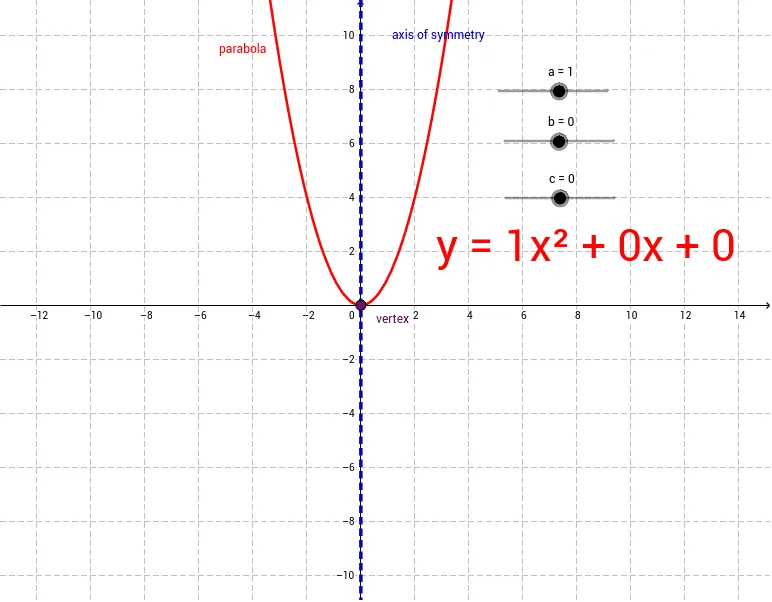
① This example demonstrates the dynamic graph of a quadratic function y = ax² + bx + c as the coefficients a, b, c vary. ② Core concepts: standard form of a quadratic, vertex, axis of symmetry, discriminant and the geometric meaning of roots. ③ Construction highlights: sliders a, b, c control coefficients; function f(x)=a*x^2+b*x+c is defined; text1 displays the algebraic expression; point A marks the vertex; line d represents the axis of symmetry; auxiliary object e marks intercepts. ④ Suitable for high‑school algebra (functions chapter), middle‑school quadratic exploration, or self‑study demonstrations.
GeoGebra Commands & Parameters
Numeric a(1.0)Numeric b(0.0)Numeric c(0.0)f(x) = a * x^(2) + b * x + c(-b) / (2 * a)(d, a * d^(2) + b * d + c)x = -1 * b / (2 * a)
AI Drawing Prompt Reference
Create a dynamic graph of a quadratic function y = a x^2 + b x + c controlled by sliders for coefficients a, b, and c. Define and plot f(x)=a*x^2+b*x+c so the curve updates as the parameters change. Compute d = (-b)/(2*a) and mark the vertex point at (d, a*d^2 + b*d + c). Display the current algebraic expression for the quadratic in the graph. Also include an auxiliary reference point/position tied to the value x = -1*b/(2*a), emphasizing the geometric meaning related to the roots and symmetry.
The prompt above was compiled from the original drawing commands and is for reference only.