
Germany Math Example
Loading the math board and drawing, please wait…
In collections
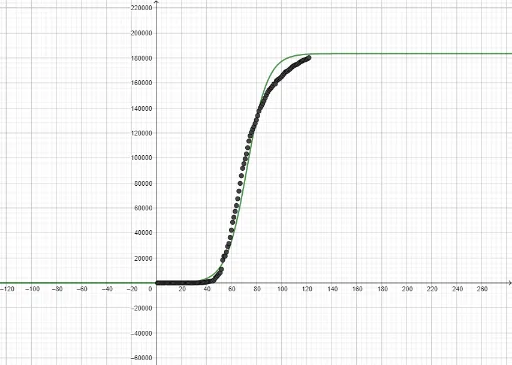
Confirmed Coronavirus Cases in Countries
This example demonstrates how to use GeoGebra to construct a series of points and draw a scatter plot. The core math concepts involved include scatter plots, geometry, numbers, random experiments, and arithmetic. The construction highlights the use of GeoGebra commands/objects like point objects (A2, B2, A3, B3, etc.). It is suitable for high school mathematics teaching, demonstrating scatter plot drawing and data analysis.
GeoGebra Commands & Parameters
2434455768798119111011111212131313141315131615171518151916201621162216231624162516261627162816291830213126
AI Drawing Prompt Reference
Draw a scatter plot with a series of randomly generated points located at different coordinates to demonstrate data distribution, suitable for high school mathematics teaching to help understand scatter plot drawing and data analysis methods.
The prompt above was compiled from the original drawing commands and is for reference only.