
Geometric Representation of a Logarithm
Loading the math board and drawing, please wait…
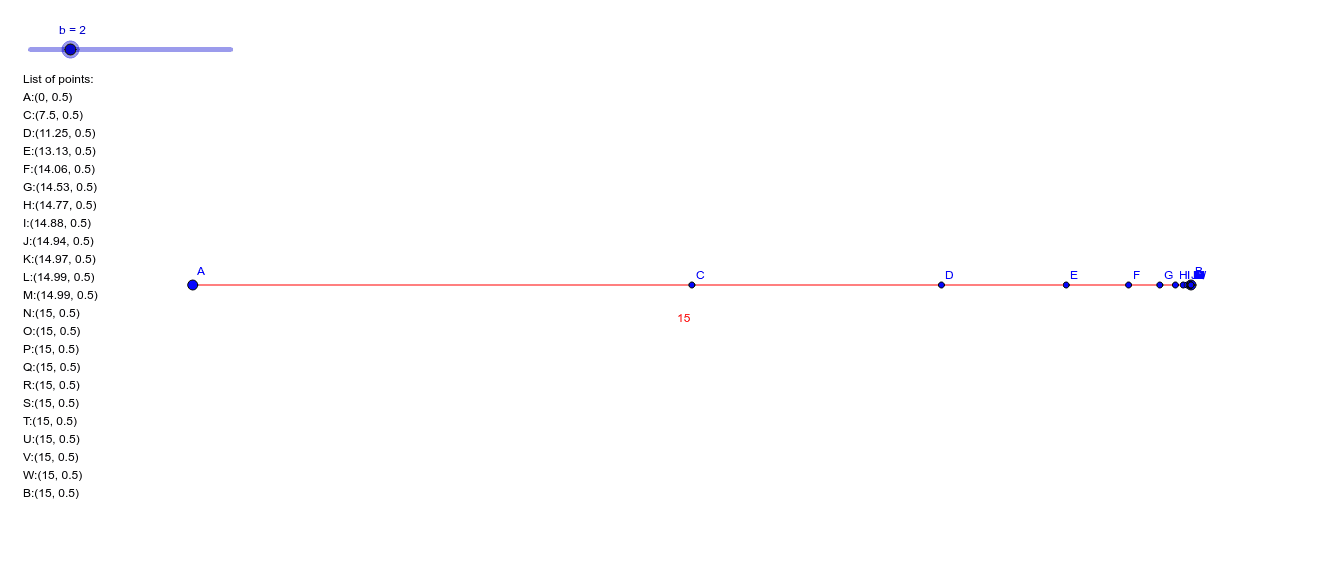
This example demonstrates the geometric representation of logarithms. It involves the properties and graph of logarithmic functions. Using points, lines, segments, and iteration lists, the example illustrates the geometric representation of logarithms. Suitable for high school mathematics education and learning.
GeoGebra Commands & Parameters
Point(yAxis) → ALine(A, xAxis) → fPoint(f) → BSegment(A, B) → gIterationList(x(B) / b + ((b - 1) / b * x), x(B) / b, 20) → list1
AI Drawing Prompt Reference
On a coordinate plane, draw a line intersecting the y-axis, representing a logarithmic function, and mark the intersection point. Then, choose a point on this line and connect it to the y-axis intersection with a segment. Using this segment and a fixed base, iteratively compute a sequence of points that approach specific positions on the logarithmic curve. Finally, plot these points to illustrate the geometric representation of the logarithm, showing its growth and coordinate relationships.
The prompt above was compiled from the original drawing commands and is for reference only.