
Geometric Practice: Comparing Mean and Median
Loading the math board and drawing, please wait…
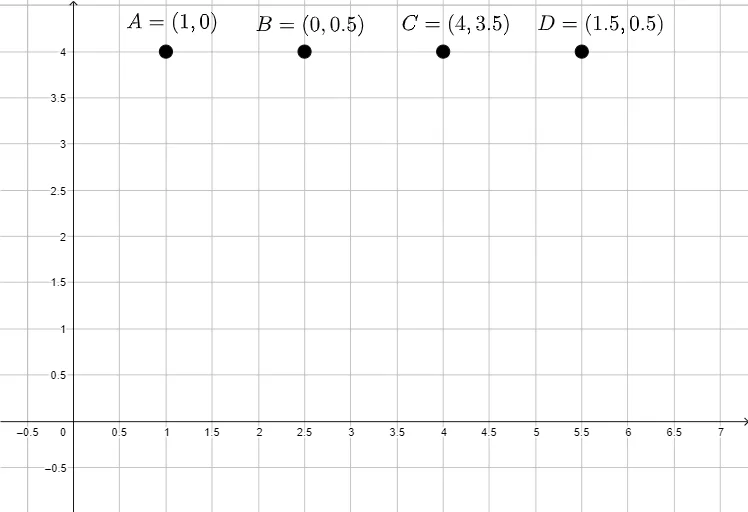
This example demonstrates, with a visual/interactive setup, how the mean and the median can occupy different “locations” for the same dataset, and why the choice of summary statistic matters. It highlights the concepts of mean, median, and standard deviation (a measure of spread), linking central tendency to variability. Construction is guided by GeoGebra objects A, B, C, and D: these points/values are used to build the geometric representation of the data, then the mean location (via an averaging/centroid-style idea) is compared against the median location (via the ordered middle value). The activity is suitable for late high school through early university courses, particularly for statistics units on descriptive measures and interactive exploration of how outliers affect mean versus median.
GeoGebra Commands & Parameters
Point A(1, 4)Point B(2.5, 4)Point C(4, 4)Point D(5.5, 4)
AI Drawing Prompt Reference
Draw four data points on a coordinate plane at the positions (1,4), (2.5,4), (4,4), and (5.5,4). Connect these points with a line segment to illustrate the distribution. Compute the average of the four points and mark the mean as a point on the same horizontal line at x≈3.25. Identify the middle value after ordering and place the median point at x≈3 on that line. Optionally shade the area between the outermost points to show the spread, and add brief labels indicating how the mean and median differ in location.
The prompt above was compiled from the original drawing commands and is for reference only.