
Geometric Construction of Volume Functions
Loading the math board and drawing, please wait…
In collections
CCGPS AA Unit 6 Lesson 5
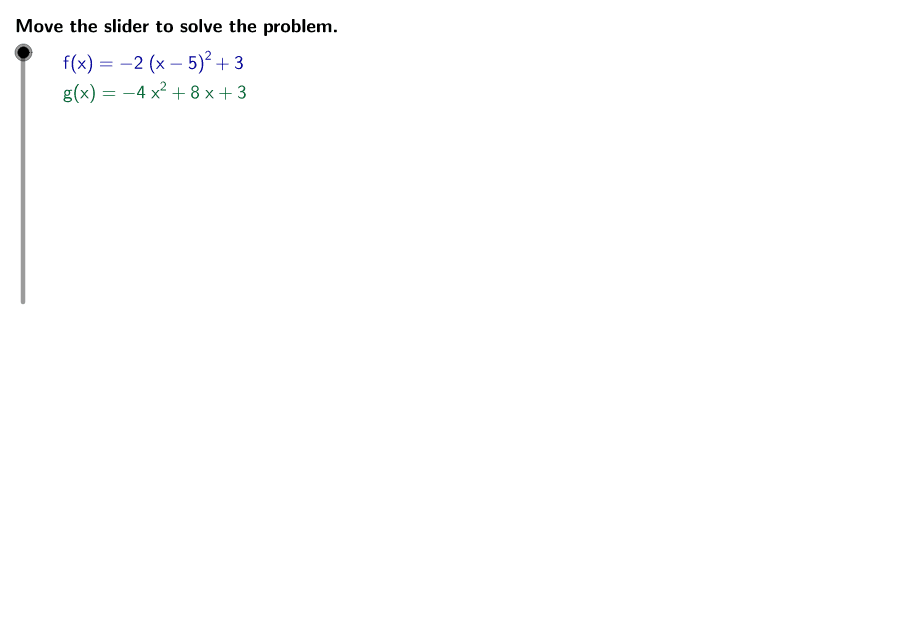
This example demonstrates how two functions, [math]f(x) = –2(x – 5)^{2} + 3[/math] and [math]g(x) = –4x^{2} + 8x + 3[/math], represent the volumes of two rectangular solids. It covers core mathematical concepts such as functions, volume calculation, and coordinate geometry. Using GeoGebra commands like LaTeX, Corner, If, and TableText, it dynamically shows the function graphs and their corresponding volume changes. Suitable for high school mathematics education, particularly for teaching coordinate geometry and function graphs.
GeoGebra Commands & Parameters
LaTeX(steps) → counterLaTeX("\text{Use the buttons below to return to the original problem or}\cr\text{randomly generate a similar practice problem.}") → RandomizationTextCorner(1) → ACorner(3) → BLaTeX("\text{Determine the coordinates of the maximum point of }\textcolor{#000099}{f(x)}.") → text1LaTeX("\text{To determine the coordinates of the maximum point of a function, first determine}\cr\text{the type of function and compare it to the standard form for that function.}") → text2LaTeX((("\text{The function }\textcolor{#000099}{f(x) = " * f) * "}\text{ is a quadratic function.}")) → text3If(ygmax > fc, LaTeX["\textcolor{#006633}{g(x)}\text{ is the function that}\cr\text{represents the greatest maximum volume for the associated rectangular solid}"], If[ygmax < fc, LaTeX["\textcolor{#000099}{f(x)}\text{ is the function that}\cr\text{represents the greatest maximum volume for the associated rectangular solid}"], LaTeX["\textcolor{#000099}{f(x)}\text{ and }\textcolor{#006633}{g(x)}\text{ represent}\cr\text{identical maximum volumes for their associated rectangular solids.}"]]) → winnerLaTeX((((((("\text{The function value of the maximum point of }\textcolor{#000099}{f(x)}\text{ is }\textcolor{#000099}{" * fc) * "}\text{, and the function value of}\cr\text{the maximum point of }\textcolor{#006633}{g(x)}\text{ is }\textcolor{#006633}{") * ygmax) * "}\text{. Therefore, }") * winner) * ".")) → text17LaTeX((("\text{The y-coordinate of the maximum point of }\textcolor{#006633}{g(x)}\text{ is }\textcolor{#006633}{" * ygmax) * "}.")) → text14LaTeX((((("\text{The maximum point of }\textcolor{#006633}{g(x)}\text{ is }\textcolor{#006633}{(" * xgmax) * ", ") * ygmax) * ")}.")) → text15LaTeX("\text{Determine the coordinates of the maximum point of }\textcolor{#006633}{g(x)}.") → text6LaTeX((("\text{The x-coordinate of the maximum point of }\textcolor{#006633}{g(x)}\text{ is }\textcolor{#006633}{" * xgmax) * "}.")) → text11LaTeX((("\text{Since }\textcolor{#006633}{a=" * ga) * "}\text{ is less than 0, }\textcolor{#006633}{g(x)}\text{ will have a maximum.}")) → text9LaTeX("\text{To determine the y-coordinate of the maximum, substitute the value of }\textcolor{#006633}{x}\text{ into the function }\textcolor{#006633}{g(x)}.") → text12TableText({{LaTeX[(("\textcolor{#006633}{g(x)=" * g) * "}")], LaTeX["\text{Given function}"]}, {LaTeX[(((((((((((("\textcolor{#006633}{g(" * xgmax) * ")=") * ga) * "(") * xgmax) * ")^2+(") * gb) * ")(") * xgmax) * ")+(") * gc) * ")}")], LaTeX[(("\text{Substitute }\textcolor{#006633}{" * xgmax) * "}\text{ for }\textcolor{#006633}{x}.")]}, {LaTeX[(((("\textcolor{#006633}{g(" * xgmax) * ")=") * ygmax) * "}")], LaTeX["\text{Simplify.}"]}}) → text13LaTeX("\text{Determine which function models the greatest maximum volume of its associated rectangular solid.}") → text16LaTeX("\text{Move the slider to solve the problem.}") → text0LaTeX("\text{The vertex form for a quadratic function is }\textcolor{#000099}{f(x) = a(x – h)^2 + k}\text{, where the}\cr\text{coordinates of the maximum }\textcolor{#000099}{(a < 0)}\text{ or minimum }\textcolor{#000099}{(a > 0)}\text{ function value are }\textcolor{#000099}{(h, k)}.") → text4LaTeX((((((((((((("\text{Since }\textcolor{#000099}{f(x) =" * f) * "}\text{ is already written in vertex form, it can be seen that for }\cr\textcolor{#000099}{f(x)}\text{, }\textcolor{#000099}{h=") * fb) * "}\text{, }\textcolor{#000099}{k=") * fc) * "}\text{, and }\textcolor{#000099}{a=") * fa) * "}\text{, which is less than 0; therefore, the maximum point of }\textcolor{#000099}{f(x)}\cr\text{is located at }\textcolor{#000099}{(") * fb) * ", ") * fc) * ")}.")) → text5LaTeX((((("\textcolor{#000099}{f(x)=" * f) * "}\cr\textcolor{#006633}{g(x)=") * g) * "}")) → ProblemLaTeX((((((((("\text{The function }\textcolor{#006633}{g(x) = " * g) * "}\text{ is also a quadratic function, but it is written}\cr\text{in standard form, }\textcolor{#006633}{f(x)=ax^2 +bx+c}\text{, where }\textcolor{#006633}{a=") * ga) * "}\text{, }\textcolor{#006633}{b=") * gb) * "}\text{, and }\textcolor{#006633}{c=") * gc) * "}.")) → text7LaTeX("\text{Recall that the x-coordinate of the maximum or minimum of a quadratic in this}\cr\text{form is }\textcolor{#006633}{x=-\frac{b}{2a}}\text{, which is a maximum if }\textcolor{#006633}{a<0}.") → text8TableText({{LaTeX["\textcolor{#006633}{x=-\frac{b}{2a}}"], LaTeX["\text{Formula for the x-coordinate}"]}, {LaTeX[(((("\textcolor{#006633}{x=-\frac{(" * gb) * ")}{2(") * ga) * ")}}")], LaTeX[(((("\text{Substitute }\textcolor{#006633}{" * gb) * "}\text{ for }\textcolor{#006633}{b}\text{ and }\textcolor{#006633}{") * ga) * "}\text{ for }\textcolor{#006633}{a}.")]}, {LaTeX[(((("\textcolor{#006633}{x=-\frac{" * gb) * "}{") * twoa) * "}}")], LaTeX["\text{Simplify.}"]}, {LaTeX[(("\textcolor{#006633}{x=" * xgmax) * "}")], LaTeX["\text{Simplify.}"]}}) → text10
AI Drawing Prompt Reference
Draw the graphs of two quadratic functions, f(x) = –2(x – 5)² + 3 and g(x) = –4x² + 8x + 3, and find their maximum points. First, draw f(x) and locate its vertex at (5, 3). Then, draw g(x) and calculate its vertex x-coordinate as 2, and substitute to find the y-coordinate as 7. Finally, compare the maximum values of the two functions to determine which one represents the greater volume.
The prompt above was compiled from the original drawing commands and is for reference only.