
GeoGebra Histogram Demonstration
Loading the math board and drawing, please wait…
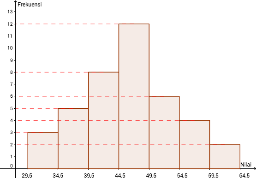
This example demonstrates how to create a histogram using GeoGebra, showcasing statistical characteristics. Core math concepts include statistics, continuity, pie charts, kites, hyperbolas, etc. Construction highlights involve commands like Histogram and Segment as per the summary. Suitable for high school mathematics teaching, particularly for visualizing probability and statistics content.
GeoGebra Commands & Parameters
Histogram({30, 35, 40, 45, 50, 55, 60, 65}, {3, 5, 8, 12, 6, 4, 2}) → aSegment(B, A) → gSegment(C, D) → fSegment(E, H) → hSegment(I, J) → iSegment(K, L) → jSegment(M, N) → kSegment(O, P) → l