
GeoGebra Geometric Construction and Statistical Analysis: Similarity and Rotatio
Loading the math board and drawing, please wait…
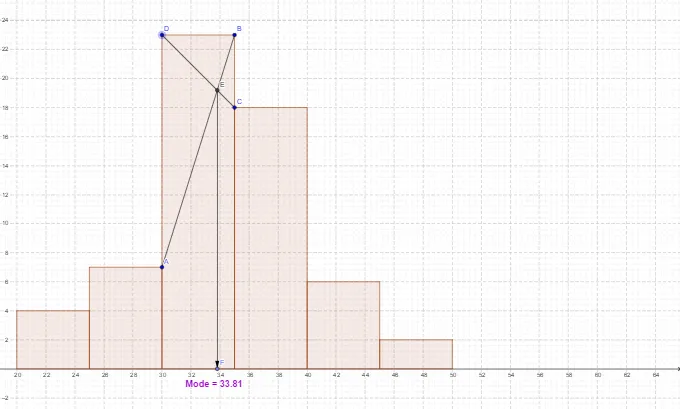
This example demonstrates how to use GeoGebra for geometric construction and statistical analysis. Key mathematical concepts include similarity of triangles, rotation, and statistical charts. Construction involves using commands like Segment, Intersect, OrthogonalLine, and objects such as Centroid or Barycenter, Pyramid. Suitable for middle or high school students learning geometric transformations and statistical foundations.
GeoGebra Commands & Parameters
Segment(C, D) → cSegment(A, B) → bIntersect(b, c) → EOrthogonalLine(E, xAxis) → fHistogram(A1:A8, B1:B7) → aIntersect(f, xAxis) → FDistance(E, xAxis) → distanceVector(E, F) → u
AI Drawing Prompt Reference
On the same plane, first draw two given segments: one connecting points C and D (segment c), and another connecting points A and B (segment b). Extend them as needed and take their intersection as point E. Through E, construct a line perpendicular to the x-axis (line f), and mark the intersection of this perpendicular with the x-axis as F. Represent the perpendicular distance from E to the x-axis as distance, and draw the vector u from E to F. Also include a histogram using the data ranges A1–A8 for the first column and B1–B7 for the second column (histogram a) to show the statistical distribution.
The prompt above was compiled from the original drawing commands and is for reference only.