
GeoGebra Exercise 3
Loading the math board and drawing, please wait…
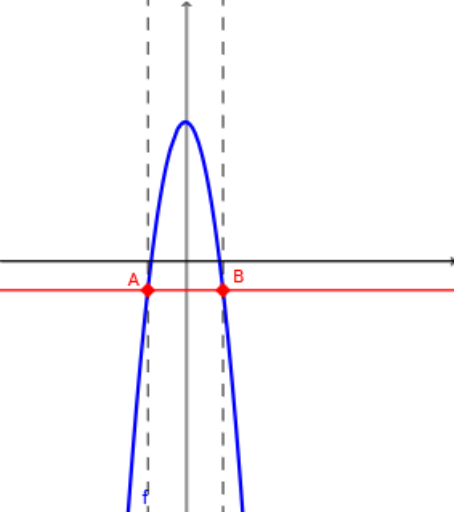
This example demonstrates interactive visualization of mathematical concepts including quadratic equations, planes, intersection, median lines, and Poisson distribution. Core concepts involve solving quadratic equations, calculating intersections of planes and lines, properties of median lines, and generating random variables following Poisson distribution. GeoGebra commands like RandomElement, Random, Textfield, Intersect, OrthogonalLine, and TableText are used for random element selection, intersection calculation, text display, and trajectory tracking. Suitable for high school and above mathematics education, focusing on probability statistics and analytical geometry applications.
GeoGebra Commands & Parameters
RandomElement({-5, -4, -3, -2, -1, 1, 2, 3, 4, 5}) → aRandomElement({-5, -4, -3, -2, -1, 1, 2, 3, 4, 5}) → cRandom(-10, 10) → dRandom(-20, 20) → bTextfield(m) → InputBox1Random(-10, 10) → pIntersect(f, k) → A, BOrthogonalLine(A, i) → gOrthogonalLine(B, i) → hTableText({{A1, B1}, {-3, f(-3)}, {-2, f(-2)}, {-1, f(-1)}, {0, f(0)}, {1, f(1)}, {2, f(2)}, {3, f(3)}}, "|_r") → text3
AI Drawing Prompt Reference
Draw a quadratic function graph with the equation y=ax^2+bx+c, where a, b, and c are randomly selected integers with a and c ranging from -5 to 5, and b ranging from -10 to 10. Then, draw two lines g and h that pass through the points (-3, f(-3)), (-2, f(-2)), (-1, f(-1)), (0, f(0)), (1, f(1)), (2, f(2)), and (3, f(3)) and are perpendicular to the x-axis. Finally, show the intersection points A and B of the function graph with the x-axis.
The prompt above was compiled from the original drawing commands and is for reference only.