
Function Investigation: Zeros and Intersections with Coordinate Axes
Loading the math board and drawing, please wait…
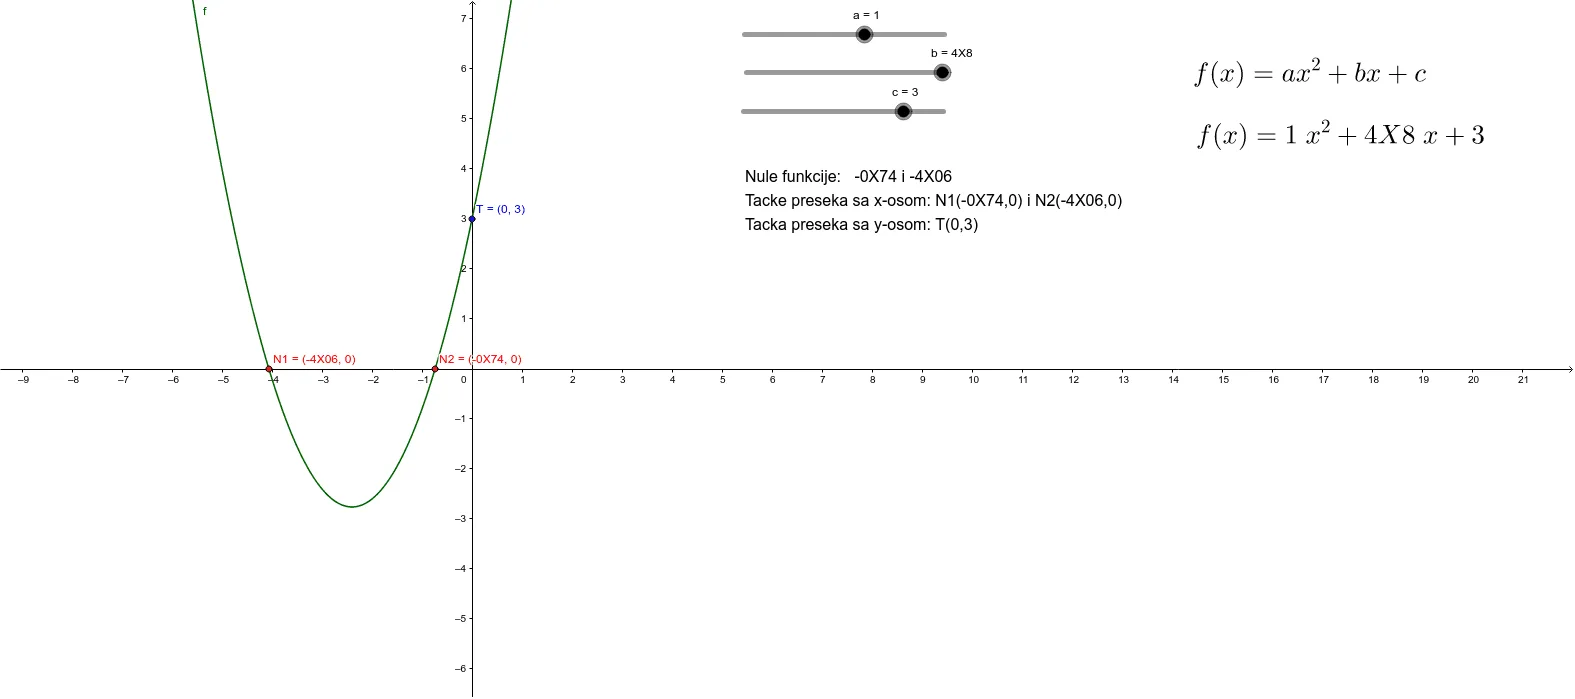
This GeoGebra example demonstrates how to investigate the zeros of a function and its intersection points with the coordinate axes. The core mathematical concepts include the zeros of a function (x-values where the function equals zero), the coordinates of intersections with the x-axis and y-axis, and the relationship between these points and the function's algebraic expression. The construction uses the Intersect command on the function f and the axes (objects a, b, c, etc.) to generate intersection points N1, N2, and T, along with auxiliary lines (ac, d, e, g) and text labels (text1 to text5) to annotate the results. This example is suitable for high school mathematics teaching or self-study on function properties, helping students visually understand the geometric meaning of zeros and intersections, and master basic GeoGebra operations for function analysis.
GeoGebra Commands & Parameters
Intersect(f, xAxis) → N1, N2Intersect(f, yAxis) → T
AI Drawing Prompt Reference
Draw a function graph and mark its intersection points with the x-axis and y-axis, labeling the coordinates of these points and the function's zeros with auxiliary lines and text, to show the geometric meaning and algebraic relationship between the zeros and the intersection points with the axes.
The prompt above was compiled from the original drawing commands and is for reference only.