
Function Guesser: Random Function Graph Generation
Loading the math board and drawing, please wait…
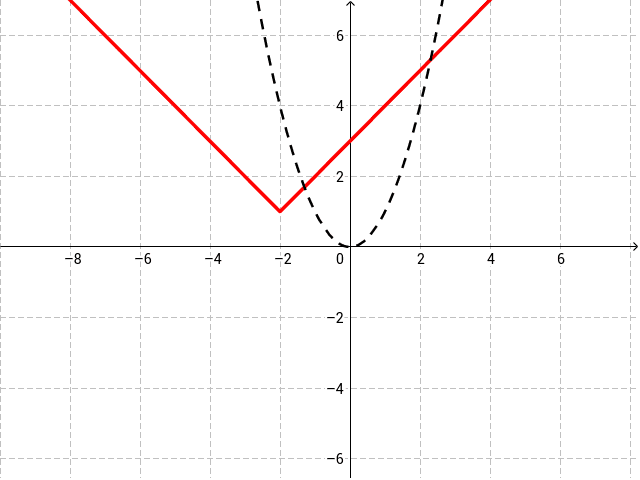
This example demonstrates how to randomly generate function graphs by selecting different types of functions such as parabolas, cube roots, etc., helping students visualize the shapes and properties of various functions. The key mathematical concepts include function definition, graph transformations, and basic function types. The construction involves using GeoGebra's random selection commands and function objects to create the graphs. It is suitable for middle or high school mathematics learning, used for initial recognition and visualization of function graphs.
GeoGebra Commands & Parameters
Random(-5, 5) → hRandom(-5, 5) → kRandom(1, 5) → nIf(n ≟ 1, (x - h)^(2) + k, If[n ≟ 2, (x - h)^(3) + k, If[n ≟ 3, (x - h)^(1 / 2) + k, If[n ≟ 4, (x - h)^(1 / 3) + k, If[n ≟ 5, abs(x - h) + k]]]]) → f
AI Drawing Prompt Reference
Randomly generate a function graph, choosing one of five types: a parabola, a cubic curve, a square root curve, a cube root curve, or an absolute value function. The graph is positioned by horizontal and vertical shifts, each randomly selected between -5 and 5. Draw the curve smoothly on a coordinate plane with visible axes. First determine the shift values, then generate the curve based on the randomly selected function type, resulting in a complete graph that illustrates the basic shape and transformation of the chosen function.
The prompt above was compiled from the original drawing commands and is for reference only.