
Function Graph Plotter: Multi‑Feature Demo
Loading the math board and drawing, please wait…
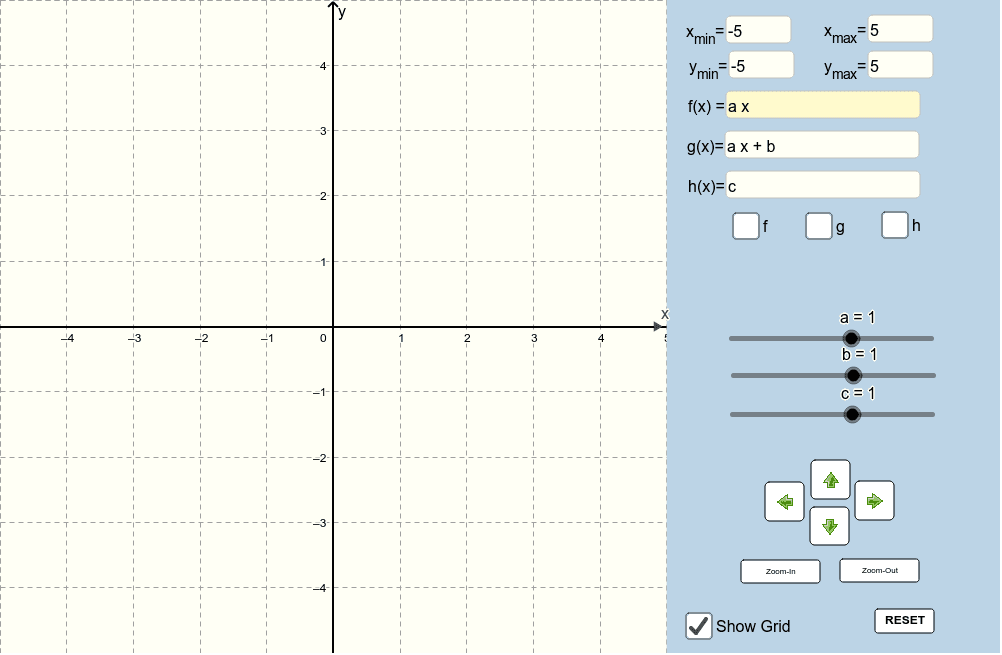
This example demonstrates a versatile function graph plotter that can dynamically draw various function curves, ellipses, tangents, and other geometric figures. Core mathematical concepts covered include function graphs, trigonometric functions, the Pythagorean theorem, ellipses, variance, and combinatorics. Construction highlights: the applet uses GeoGebra commands such as Textfield and Polygon, and creates objects including c, b, a, xmin, xmax, deltax, ymax, k, Schaltfläche1, f, Textfeld2, Schaltfläche2, Textfeld1, Textfeld3, ymin, Textfeld4, Textfeld5, Schaltfläche3, E1, xmaxhilfe, E3, E4, E2, Vieleck1, e1, e2, e3, e4, Schaltfläche4, Schaltfläche5, kogitter, deltay, xText, xpfeil, XPfeil, Pfeil, Schaltfläche6, Schaltfläche7, g, Textfeld6. It is suitable for high‑school mathematics instruction, college preparatory courses, and self‑study, supporting exploration of function graphs, geometric constructions, and interactive teaching.
GeoGebra Commands & Parameters
Textfield(f) → Textfeld2Textfield(xmin) → Textfeld1Textfield(xmax) → Textfeld3Textfield(ymin) → Textfeld4Textfield(ymax) → Textfeld5Polygon(E1, E2, E3, E4) → Vieleck1, e1, e2, e3, e4Textfield(g) → Textfeld6Textfield(h) → Textfeld7
AI Drawing Prompt Reference
Please draw a function graph display with an ellipse, a function curve, and text boxes to label coordinate ranges and function values. The construction order is to draw the ellipse first, then the function curve, and finally add text boxes for labeling.
The prompt above was compiled from the original drawing commands and is for reference only.