
Function and Its Derivative Visualization
Loading the math board and drawing, please wait…
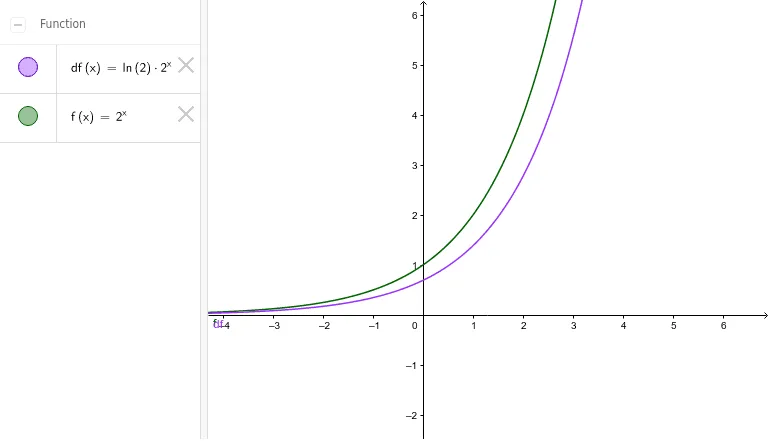
① This GeoGebra example dynamically displays a function f and its derivative df, illustrating the relationship between the rate of change and the slope of the curve. ② Core mathematical concepts include derivatives, tangent slopes, monotonicity, and fundamental calculus ideas, covering linear, logarithmic, and trigonometric functions. ③ Construction highlights: the Derivative command is used to compute df from f, and both graphs are plotted simultaneously; by adjusting parameters or sliders, users can observe how the derivative graph changes, reinforcing the geometric interpretation of the derivative as the slope of the tangent line at each point. ④ Suitable for high school to early college calculus courses, this tool aids in teaching the definition and geometric meaning of derivatives, as well as differentiation rules for common functions, and serves as an interactive exploration resource for students.
GeoGebra Commands & Parameters
Derivative(f, x) → df
AI Drawing Prompt Reference
Draw a function f and its derivative df to illustrate the relationship between monotonicity and tangent slopes. First, plot the function f, then use the derivative command to calculate df and plot both graphs simultaneously. Adjust parameters or sliders to observe changes in the derivative graph and understand the geometric meaning of the derivative as the slope of the tangent line.
The prompt above was compiled from the original drawing commands and is for reference only.