
Fun with Limits and Function Graphs
Loading the math board and drawing, please wait…
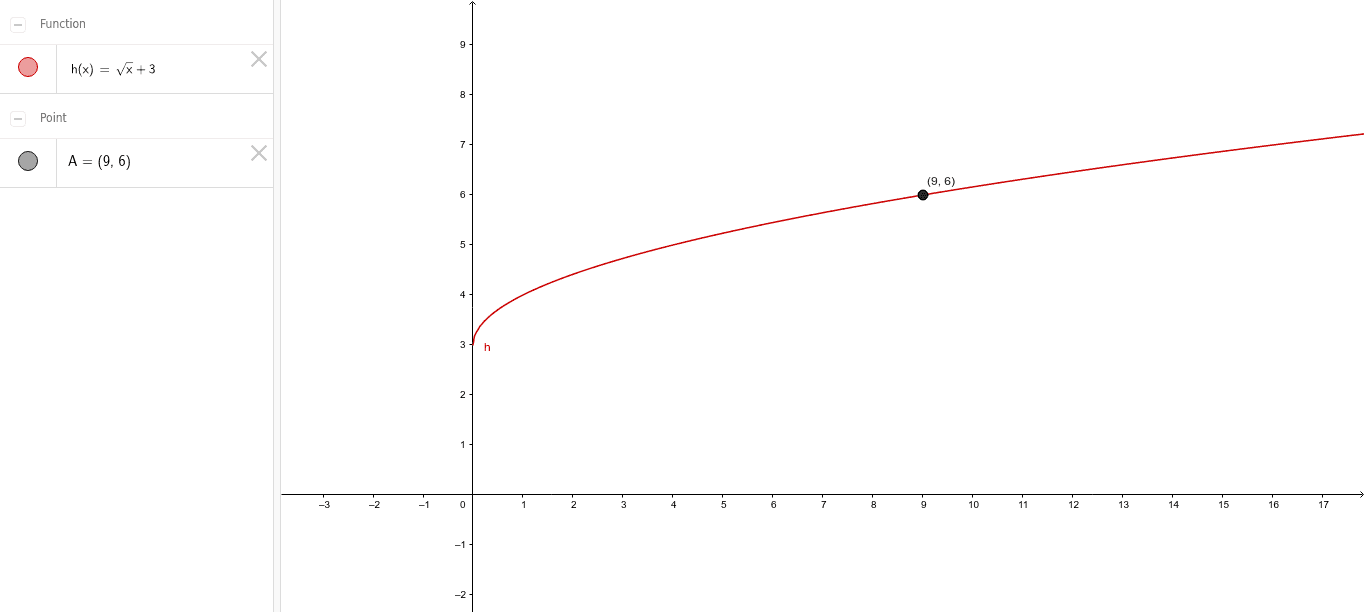
This example dynamically demonstrates the relationship between limit concepts and function graphs, particularly involving step functions. Key math concepts include limits, step functions, function graphs, general quadrilaterals, reflection, and similar triangles. It uses GeoGebra's Point command to create points h and A. Suitable for high school mathematics teaching to help students visually understand limit operations and function properties.
GeoGebra Commands & Parameters
Point(h) → A
AI Drawing Prompt Reference
Draw a function graph to demonstrate the concept of limits, particularly involving step functions. Include a point that dynamically illustrates the limit process, along with geometric constructions like reflection and similar triangles to help students understand function properties and limit operations.
The prompt above was compiled from the original drawing commands and is for reference only.