
Fractions and Geometry Demonstration
Loading the math board and drawing, please wait…
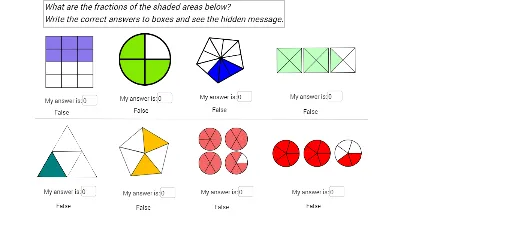
This example demonstrates the basic concept of fractions and their application in geometry through interactive graphics; Core math concepts include fractions, histograms, expected value, trigonometric functions, prisms, and cuboids; Construction highlights: Uses Textfield and Segment commands to create multiple input boxes and text displays, involving objects like a, b, c, d, e, f, g, h, i, j, k, l, m, n, o, p, A, B, C, D, G, H, etc., to build and show geometric shapes and fraction relationships; Suitable for middle school and above mathematics teaching, aiding in understanding fractions, geometric solids, and statistical charts.
GeoGebra Commands & Parameters
Textfield(a) → InputBox1Textfield(c) → InputBox2Textfield(e) → InputBox3Textfield(g) → InputBox4Textfield(i) → InputBox5Textfield(k) → InputBox6Textfield(m) → InputBox7Textfield(o) → InputBox8Segment(Q, R) → q
AI Drawing Prompt Reference
Create an interactive graphic to demonstrate fractions and their application in geometry, including multiple input boxes for entering values, and use line segments to connect points to construct geometric shapes, showing fraction relationships and geometric solids, suitable for middle school mathematics teaching.
The prompt above was compiled from the original drawing commands and is for reference only.