
Fraction Visualization by Jan Elemans
Loading the math board and drawing, please wait…
In collections
Module 2: Fractions
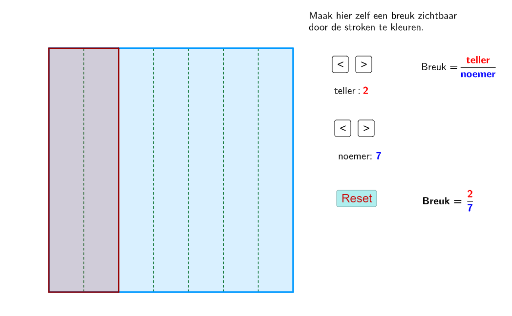
This example demonstrates fractions visually, aiding students' understanding of the concept and representation. It involves core math concepts like fractions, area, linear functions, parabolas, binomial distributions, and 3D vectors. Constructed using GeoGebra commands such as Intersect, Point, Polygon, and Sequence, it is suitable for middle school and above learners to deepen their comprehension of fractions and related mathematical phenomena.
GeoGebra Commands & Parameters
Intersect(xAxis, yAxis) → APoint(xAxis) → BPolygon(A, B, 4) → poly1, a, b, c, d, C, DSequence((x(A) + (p * i), y(A)), i, 1, noemer) → list1Sequence((x(D) + (p * j), y(D)), j, 1, noemer) → list2Sequence(Segment[Element[list1, k], Element[list2, k]], k, 1, noemer) → list3Polygon(A, E, F, D) → poly2, a_1, e, f, d_1
AI Drawing Prompt Reference
Draw a quadrilateral and mark its intersection point with the x and y axes. From this point, create multiple small quadrilaterals by drawing line segments along the edges of the larger quadrilateral, visually representing fractional areas and the integration of geometry and functions.
The prompt above was compiled from the original drawing commands and is for reference only.