
Fraction Addition Visualization v.1
Loading the math board and drawing, please wait…
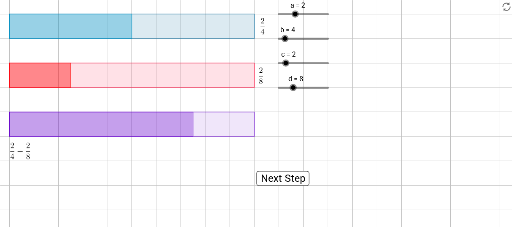
① This example demonstrates fraction addition through geometric representations, where numerators and denominators are shown as polygon areas and side lengths, and the least common multiple (LCM) is used to unify denominators before adding. ② Core mathematical concepts include fraction addition, common denominators, least common multiple, area and ratio relationships, and the correspondence between geometric objects and numerical operations. ③ Construction highlights: using GeoGebra commands Point and Polygon to create multiple polygons (poly1 to poly4), the LCM command to compute the least common multiple of denominators, and objects such as points A, B, C, D and segments a_1, b_1 to build the fraction model, finally showing the addition result through area superposition. ④ Suitable for upper elementary to middle school students to understand the geometric meaning of fraction operations, and for teachers to create interactive fraction teaching materials that help students intuitively grasp the principles of common denominators and addition.
GeoGebra Commands & Parameters
Point(Circle[A, 1]) → BPolygon(A, B, C, D) → poly1, a_1, b_1, c_1, d_1Point(Circle[E, 10]) → FPolygon(E, F, G, H) → poly2, e, f, g, hPolygon(I, J, K, L) → poly3, i, j, k, lPolygon(A, B, M, N) → poly4, a_2, b_2, m, nPolygon(H, E, O, P) → poly5, h_1, e_1, o, pPolygon(I, J, Q, R) → poly6, i_1, j_1, q, rLCM(b, d) → s