
Flipping Two Coins
Loading the math board and drawing, please wait…
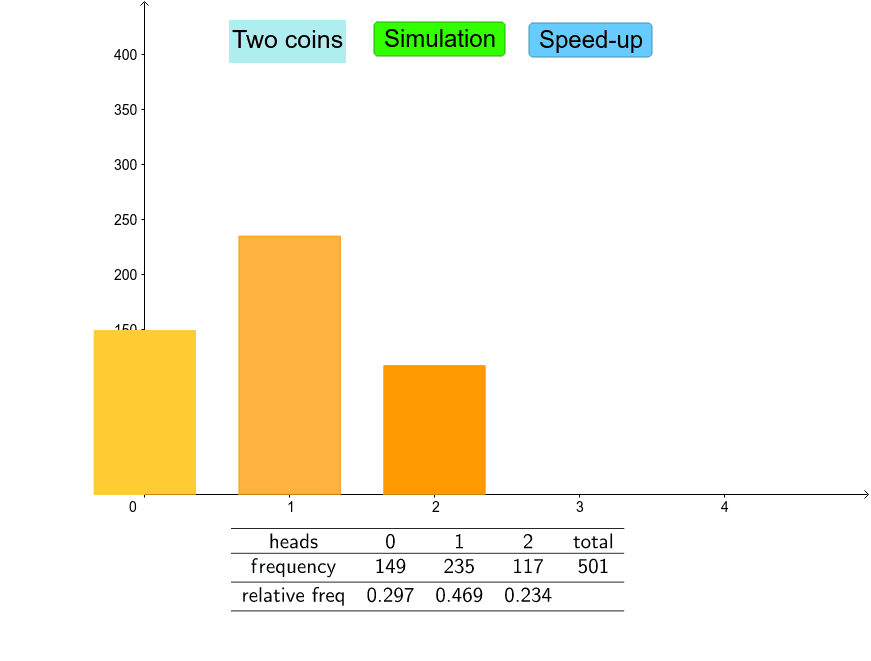
This example demonstrates all possible outcomes of flipping two coins. It involves probability and statistics. Using commands like Random and BarChart, a frequency histogram of coin flips can be constructed. Suitable for middle school and above students to learn probability and statistics.
GeoGebra Commands & Parameters
Frequency(sumlist) → freqSum(freq) → bUnique(sumlist) → list1Random(0, 1) → coin2Random(0, 1) → coin1BarChart(sumlist, 0.7) → aAppend("frequency", freq) → row2Append("heads", list1) → row1Append("relative freq", rel) → row3Append(row1, "total") → row1aAppend(row2, b) → row2aTableText({row1a, row2a, row3}, "c_") → text2
AI Drawing Prompt Reference
Create a visualization showing all possible outcomes of flipping two coins, including a bar chart displaying the frequency of each outcome and a table listing each outcome (heads or tails), the total count, and relative frequency.
The prompt above was compiled from the original drawing commands and is for reference only.