
Finding Intersections of Two Graphs
Loading the math board and drawing, please wait…
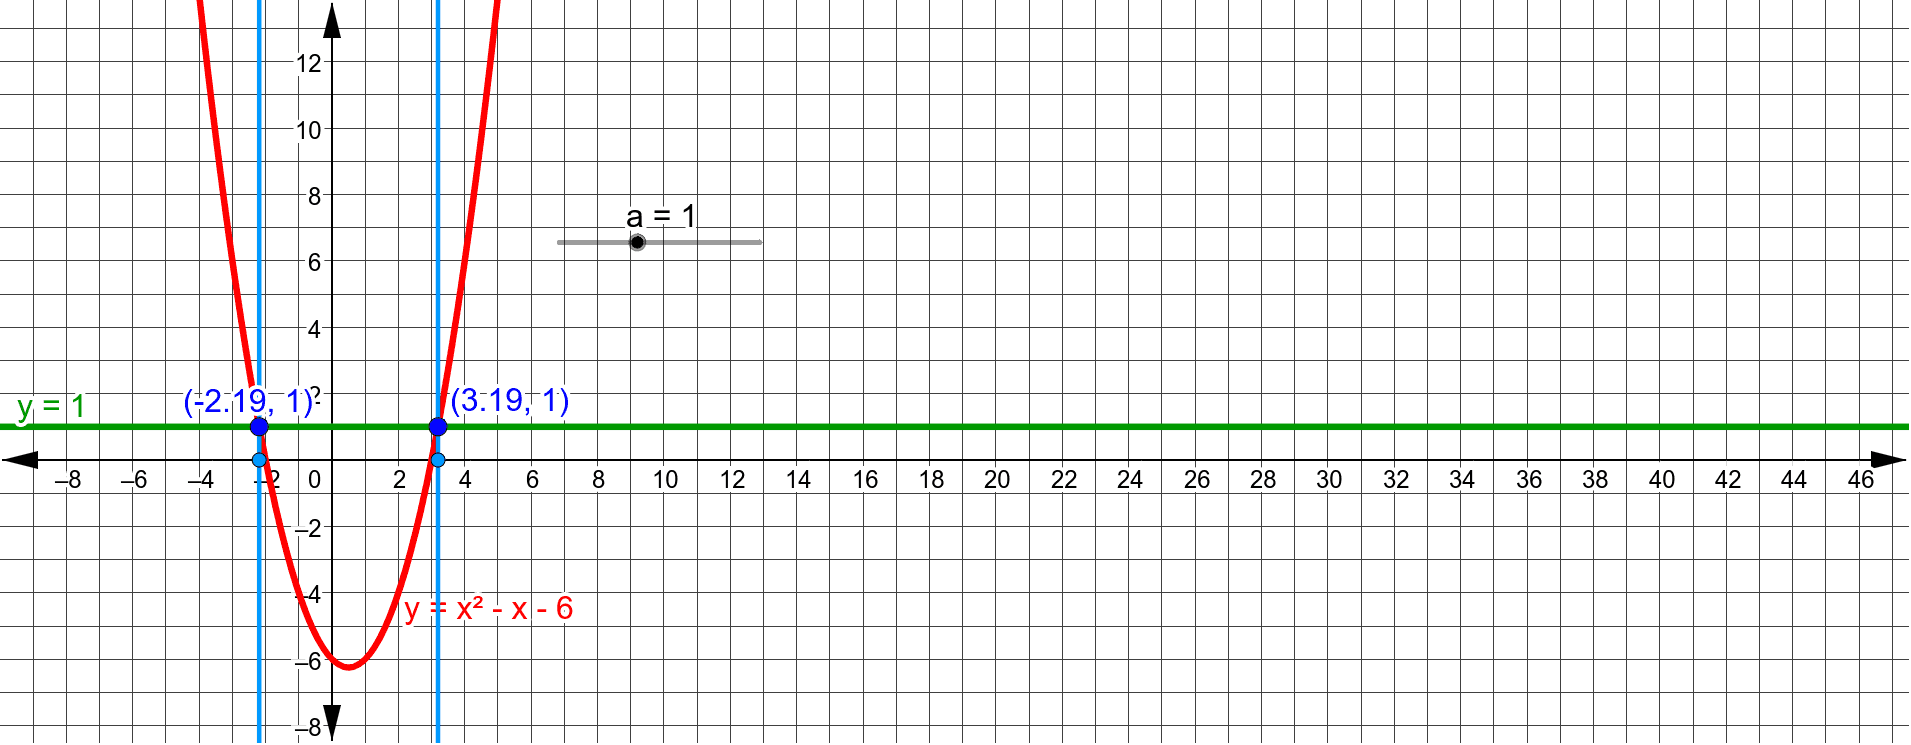
This example demonstrates how to use GeoGebra to find the intersection points of two function graphs. Key math concepts include functions, coordinate geometry, and intersection calculations. The construction involves commands/objects like c, a, f, A, B, C, D, g, h for function definition, graph plotting, and intersection marking. Suitable for high school students learning about the geometric meaning and calculation of function graph intersections.
GeoGebra Commands & Parameters
y = x^(2) - x - 6Numeric a(1.0)y = a((1 - sqrt((4 * a) + 25)) / 2, a)((1 + sqrt((4 * a) + 25)) / 2, a)((1 - sqrt((4 * a) + 25)) / 2, 0)((1 + sqrt((4 * a) + 25)) / 2, 0)x = (1 - sqrt((4 * a) + 25)) / 2x = (1 + sqrt((4 * a) + 25)) / 2
AI Drawing Prompt Reference
Draw a coordinate system with a parabola y = x^2 - x - 6 and a horizontal line y = a, where a is set to 1.0. Find and mark the two intersection points between the line and the parabola. Then, project these intersection points vertically onto the x-axis to get four points. Finally, draw lines connecting these points to show the relationship between the intersection points of the function graph and the line, as well as their projections onto the coordinate axes.
The prompt above was compiled from the original drawing commands and is for reference only.