
Find Slope-Intercept Equation
Loading the math board and drawing, please wait…
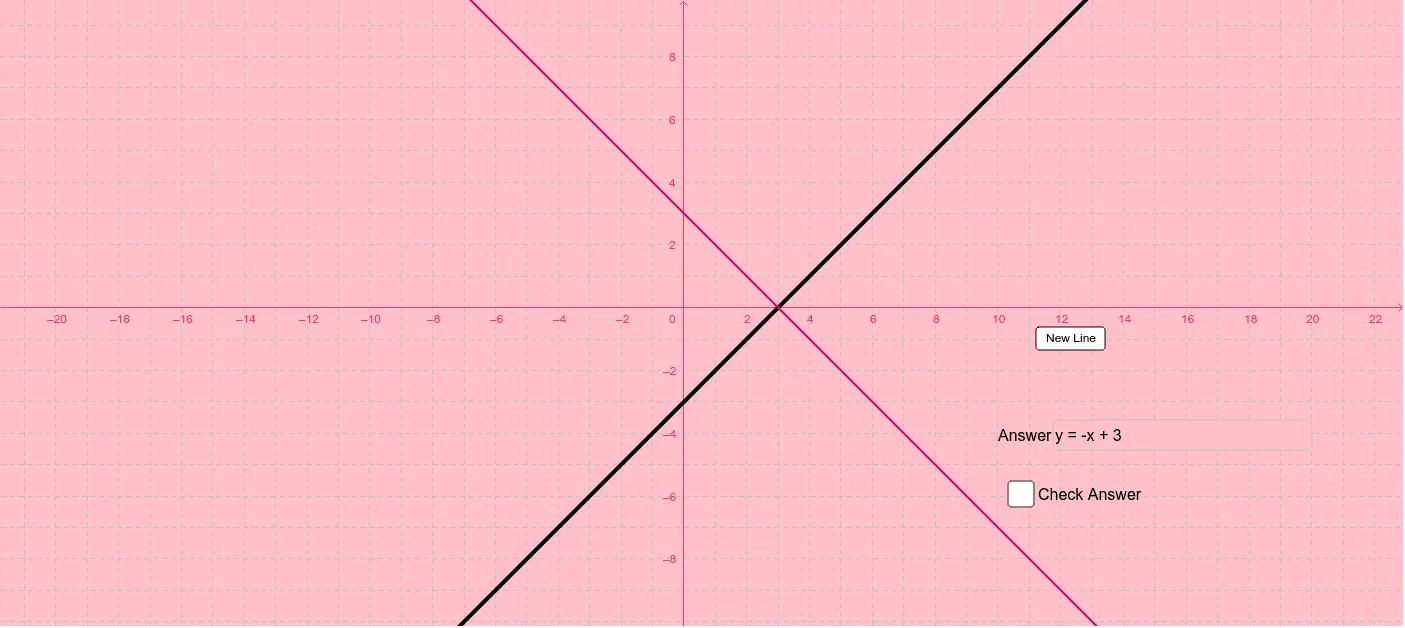
This example demonstrates how to graphically verify the correctness of a linear equation in slope-intercept form y=mx+b. Key math concepts include slope (m), y-intercept (b), and linear equation graphing. Construction highlights involve using Random command for generating random data, Textfield and inputBox1 for input/output, sliders or variables m and b to control slope and intercept, button1 to trigger calculations, text1 to display results, and potentially a, c, d for auxiliary computations or graphics. Suitable for middle school and above students learning linear equations and analytical geometry, ideal for classroom demonstrations or homework practice.
GeoGebra Commands & Parameters
Random(-5, 5) → mRandom(-5, 5) → bTextfield(d) → inputBox1
AI Drawing Prompt Reference
Draw a coordinate system with randomly generated slope m and y-intercept b, plot the corresponding line y=mx+b, display the values of m and b, and include an input box to verify the correctness of the linear equation.
The prompt above was compiled from the original drawing commands and is for reference only.