
Find Amplitude, Period, and Mean for Sin Function
Loading the math board and drawing, please wait…
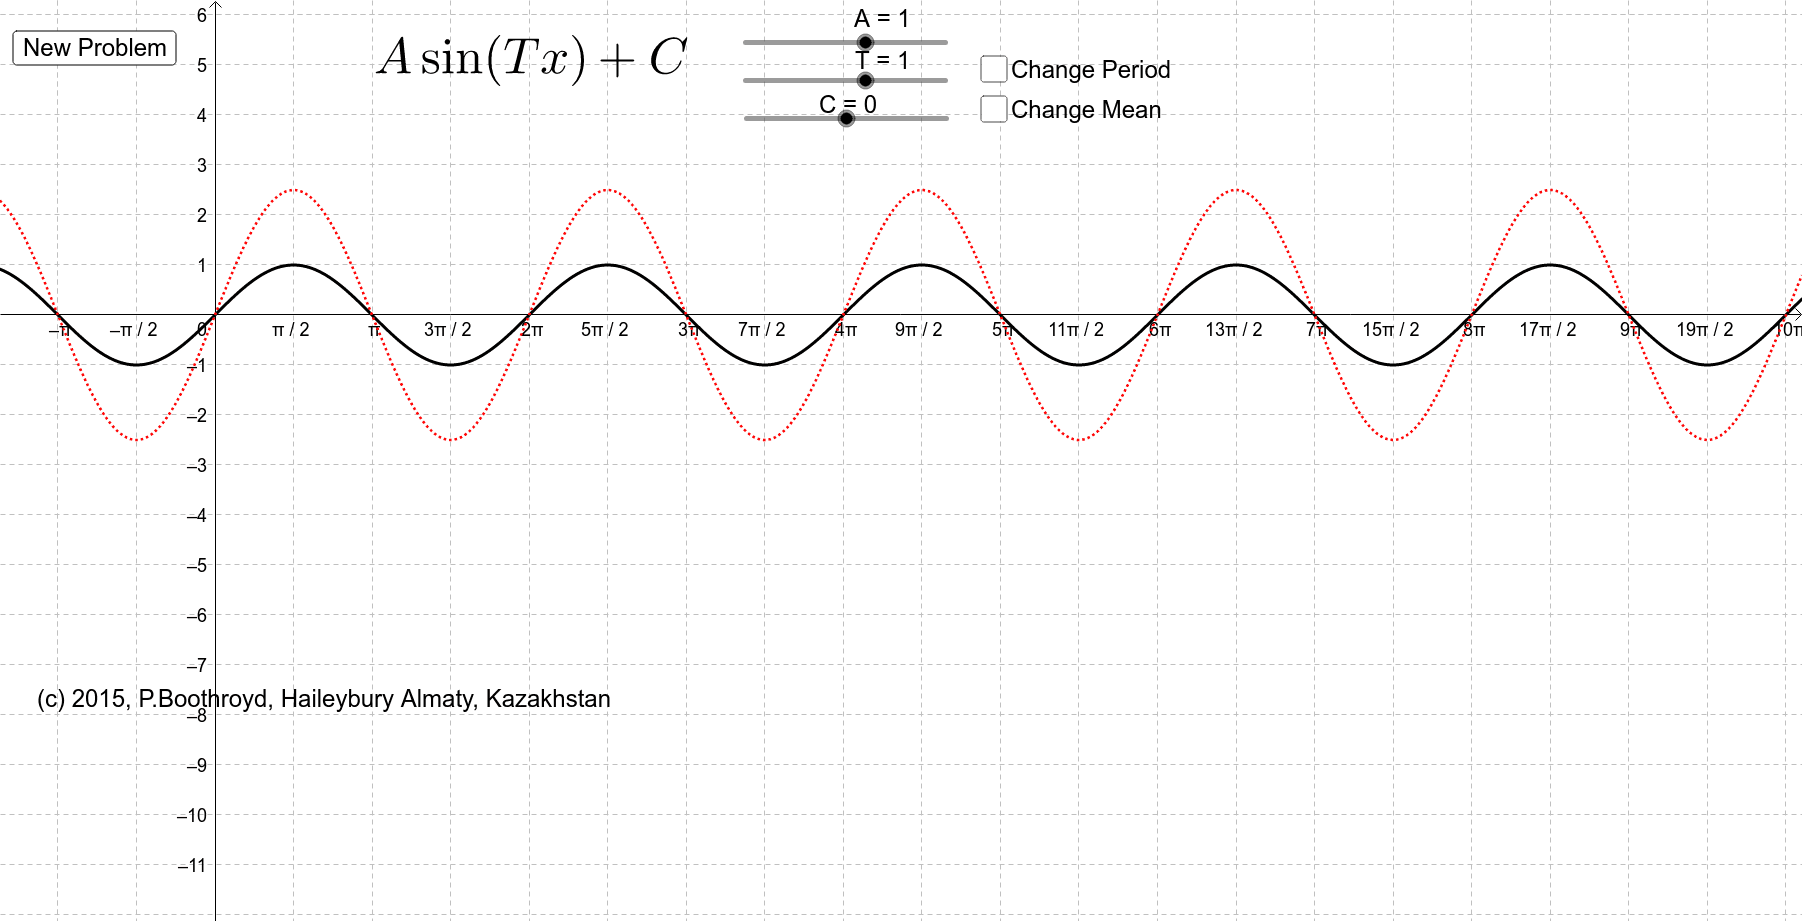
This example demonstrates how to match the amplitude, period, and mean of a sine function. It involves core math concepts like sine function graph characteristics, amplitude, period, and mean. The construction uses GeoGebra commands If and objects such as probperiod, probmean, text1, A, T, C, f, A_1, C_1, T_1, f_1, button1, text2 for conditional judgments and dynamic displays. Suitable for high school students to understand the parametric properties of sine function graphs and enhance function graph analysis skills.
GeoGebra Commands & Parameters
If(probmean, Random[-10, 10] / 2, 0) → C_1If(probperiod, If[Random[1, 5] ≤ 1, 1 / 2^(Random[0, 2]), Random[1, 4]], 1) → T_1
AI Drawing Prompt Reference
Draw a sine function graph and display its amplitude, period, and mean. First, randomly generate a mean, which is a number between -10 and 10 divided by 2 if a condition is met, otherwise it is 0. Then, randomly generate a period, which is 1/2 raised to a power or a number between 1 and 4 if a condition is met, otherwise it is 1. Label these values on the graph and display them dynamically with text.
The prompt above was compiled from the original drawing commands and is for reference only.