
Ferris Wheel for Graphing Trig Functions
Loading the math board and drawing, please wait…
In collections
Trigonometry ML
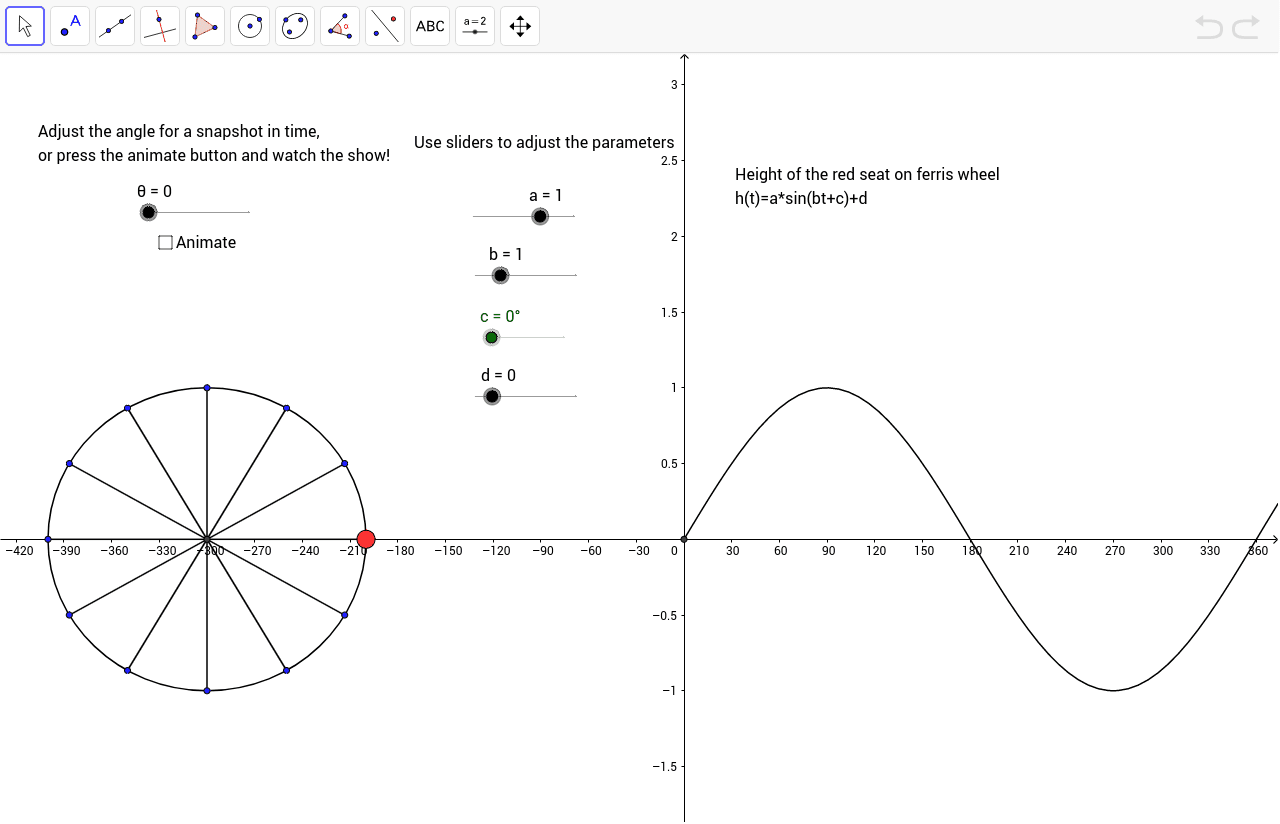
This example demonstrates how adjusting parameters a, b, c, d in y=asin(bx+c)+d affects the trigonometric function graph using sliders. Key math concepts include trigonometric functions, function graph transformations, and the impact of parameters on function graphs. It uses GeoGebra commands like Slider, Function, and Text objects. Suitable for high school mathematics teaching to understand transformations of trigonometric function graphs.
GeoGebra Commands & Parameters
If(x > 0, a * sin(b * x * π / 180 + c) + d) → fSegment(D, J) → gSegment(F, K) → hSegment(E, L) → iSegment(G, M) → jSegment(H, N) → lSegment(I, O) → m
AI Drawing Prompt Reference
Draw a graph demonstrating the transformation of a sine function using a Ferris wheel, where adjusting sliders for parameters a, b, c, d changes the function y=asin(bx+c)+d. Show the spokes connecting points on the wheel's rim to visualize the impact of parameter changes on the function graph.
The prompt above was compiled from the original drawing commands and is for reference only.