
Fehr Problem 6&7
Loading the math board and drawing, please wait…
In collections
Phantom Graphs
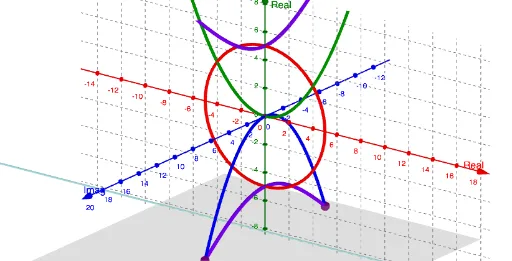
This example illustrates the geometric distribution and boxplot in Fehr's problems 6 and 7. Using GeoGebra commands like CurveCartesian, users can visually understand the concept of geometric distribution in probability and statistics. Suitable for high school math education and learning.
GeoGebra Commands & Parameters
CurveCartesian(0, (5 * cosh(t)), (5 * sinh(t)), t, -25, 25) → bCurveCartesian(0, (-5 * cosh(t)), (5 * sinh(t)), t, -25, 25) → hCurveCartesian(0, (-3 * t^(2) / 16), t, t, -50, 50) → e