
Exponential Functions with Sliders
Loading the math board and drawing, please wait…
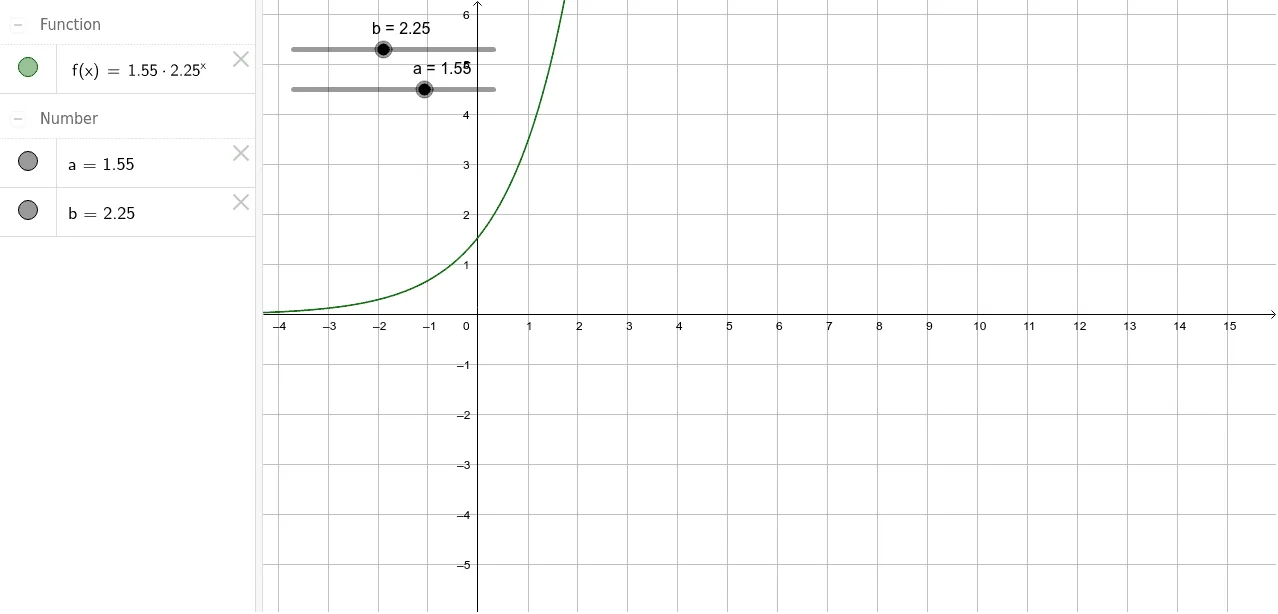
This example demonstrates how to dynamically control exponential function graphs using sliders. What it shows: Dragging the sliders allows real-time observation of how the exponential function y=a·b^x changes as parameters a (coefficient) and b (base) vary, clearly displaying the growth or decay characteristics of exponential functions. Math concepts involved: exponential functions, effects of base and coefficient, function transformation rules. Construction: Use GeoGebra's Slider tool to create parameters a and b, define function f(x)=a*b^x, plot its graph, and control parameter values dynamically via sliders. Suitable for: high school mathematics teaching, exploring exponential function properties, intuitive understanding of how parameter changes affect function graphs, and can also serve as a visual demonstration tool for Poisson distribution in probability and statistics.
GeoGebra Commands & Parameters
Numeric a(1.55)Numeric b(2.25)f(x) = (a * b^(x))
AI Drawing Prompt Reference
Draw an exponential curve y = a·b^x with two draggable sliders that adjust the coefficient a and the base b, initially set to 1.55 and 2.25; as the sliders move the graph updates in real time, showing how changes in a and b affect growth or decay behavior. The sliders should be clearly labeled and allow continuous variation, enabling the user to observe the immediate impact on the curve’s steepness and direction.
The prompt above was compiled from the original drawing commands and is for reference only.