
Exponential Functions Basics
Loading the math board and drawing, please wait…
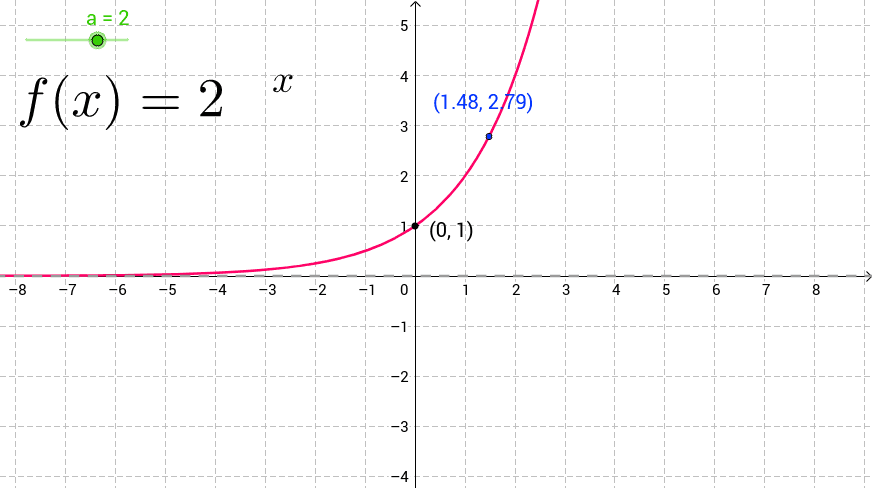
①This example visualizes basic exponential functions, illustrating growth and decay curves, asymptotes, intercepts, and parameter effects. ②Key mathematical concepts covered are exponential functions, base, exponent, domain, range, asymptotes, transformations, and coordinate geometry. ③The construction employs GeoGebra commands Point and Intersect, using objects a, b, c, f, A, B, C, d, and text labels text1, text2 to define points, intersections, and annotations. ④Designed for high‑school algebra through introductory college pre‑calculus courses, it serves as an instructional tool for teaching exponential function fundamentals.
GeoGebra Commands & Parameters
Point(f) → AIntersect(f, xAxis, (-7497.650764102542, 0)) → BIntersect(f, yAxis, (0, 1)) → C
AI Drawing Prompt Reference
Draw a basic graph of exponential functions showing growth and decay curves, asymptotes, intercepts, and parameter effects. Include points, intersections, labels, and axes to help understand the concept of exponential functions.
The prompt above was compiled from the original drawing commands and is for reference only.