
Exponential Functions and Their Graphs (Ch 6.3)
Loading the math board and drawing, please wait…
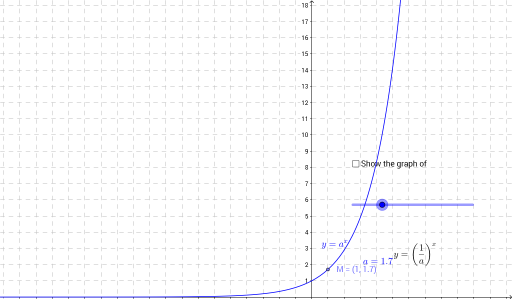
①This example demonstrates the graphs of exponential functions y=a^x, showing how the shape changes with the base a. ②Core mathematical concepts include the definition of exponential functions, the effect of the base on monotonicity, the fixed point (0,1), and the rapid growth or decay behavior. ③Construction details: from the summary, Point commands create points (A, B, C, D, M), while function objects f and g define the curves, and text objects label expressions and coordinates; additional elements like geometric mean, pie chart, or circumcircle may support visualization. ④Suitable for high school or introductory college algebra courses, useful for classroom demonstration or self-study to explore how varying the base transforms the graph.
GeoGebra Commands & Parameters
Point(f) → APoint(g) → BPoint(f) → M
AI Drawing Prompt Reference
Draw a Cartesian coordinate plane with two exponential curves, one with base greater than 1 showing increasing behavior, and the other with base between 0 and 1 showing decreasing behavior. Both curves pass through the common point (0,1). Place three marked points on the curves: two on the increasing curve and one on the decreasing curve, indicated by small dots. Label each curve with its function expression like y=a^x, and display the coordinates of the marked points. The graph illustrates how changing the base affects the shape, monotonicity, and growth or decay rate of exponential functions.
The prompt above was compiled from the original drawing commands and is for reference only.