
Exploring Voronoi Diagrams
Loading the math board and drawing, please wait…
In collections
Voronoi Diagrams
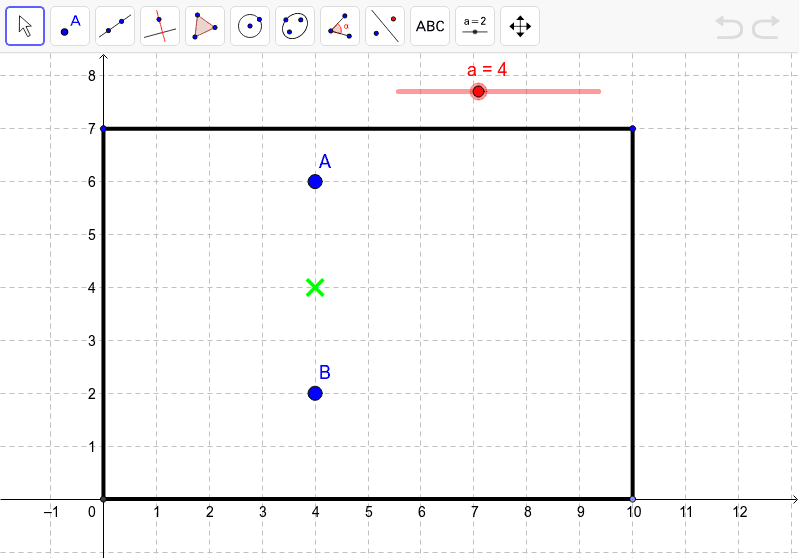
This example demonstrates how to generate Voronoi diagrams using a set of points. A Voronoi diagram is a partitioning of a plane into regions based on the distance to a specific set of points. The core mathematical concepts involved include geometric construction and point set analysis. By using commands like Intersect, Point, and Segment, users can dynamically explore the boundary points of Voronoi diagrams. Suitable for high school students and math enthusiasts.
GeoGebra Commands & Parameters
Intersect(xAxis, yAxis) → EPoint(xAxis) → FSegment(D, E) → bSegment(E, F) → cSegment(F, G) → dSegment(G, D) → e
AI Drawing Prompt Reference
Draw a shape formed by two intersecting axes and four points, connecting each axis point to the others to create four line segments, illustrating a simple polygon boundary for exploring distance and region concepts.
The prompt above was compiled from the original drawing commands and is for reference only.