
Exploring the Quadratic Function
Loading the math board and drawing, please wait…
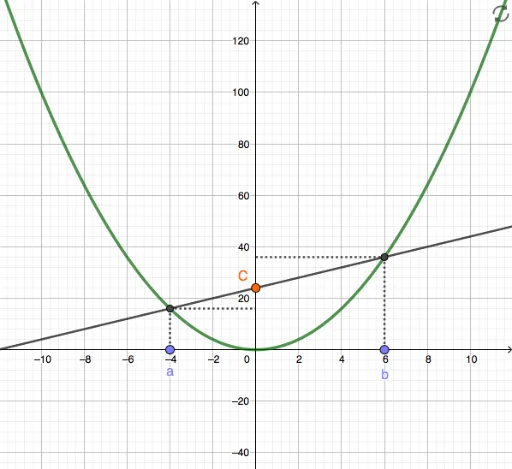
This example demonstrates the graph of a quadratic function and its relationship with a parabola. It involves core mathematical concepts like quadratic functions, parabolas, complex numbers, and coordinate geometry. The construction uses GeoGebra commands such as Point, OrthogonalLine, Intersect, Line, and Segment. Suitable for high school mathematics teaching and function graph exploration.
GeoGebra Commands & Parameters
Point(xAxis) → APoint(xAxis) → BOrthogonalLine(A, xAxis) → gOrthogonalLine(B, xAxis) → hIntersect(f, g, 1) → C_1Intersect(f, h, 1) → DLine(C_1, D) → iIntersect(i, yAxis) → COrthogonalLine(C_1, yAxis) → jOrthogonalLine(D, yAxis) → kIntersect(k, yAxis) → GSegment(G, D) → lSegment(D, B) → mIntersect(j, yAxis) → HSegment(C_1, A) → nSegment(C_1, H) → p
AI Drawing Prompt Reference
Draw a coordinate plane with a parabola representing a quadratic function. Place two distinct points on the x-axis and draw vertical lines through each, intersecting the parabola at two points. Connect these two intersection points with a straight line, which crosses the y-axis at a point. From each intersection point, draw a horizontal line to the y-axis, marking the points where they meet. Then, connect each intersection point to its corresponding x-axis point and to its corresponding y-axis point using line segments. The final figure shows the parabola, two vertical lines, one slanted line, two horizontal lines, and several segments illustrating the geometric relationships.
The prompt above was compiled from the original drawing commands and is for reference only.