
Exploring the Mean Value Theorem
Loading the math board and drawing, please wait…
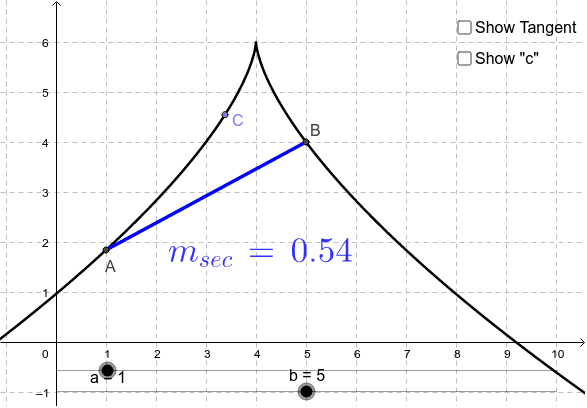
This example demonstrates the Mean Value Theorem by showing a point on a function's graph where the tangent line's slope equals the average rate of change over an interval. Key concepts include derivatives, tangent lines, and average rate of change. Construction involves using GeoGebra commands to draw functions, tangents, secants, and calculate slopes. Suitable for high school or undergraduate students learning calculus.
GeoGebra Commands & Parameters
Segment(A, B) → SecantPoint(f) → CTangent(C, f) → TangentSlope(Tangent) → m_{tan}Slope(Secant) → m_{sec}LaTeX(m_{sec}, true, true) → text1LaTeX(m_{tan}, true, true) → text2LaTeX(c, true, true) → text3
AI Drawing Prompt Reference
Draw a graph of a function showing a point on the curve where the tangent line's slope equals the average rate of change over an interval. Include the function curve, tangent line, secant line connecting interval endpoints, and text labels for slopes. Construct in order: draw function, locate point, draw tangent and secant, then label slopes.
The prompt above was compiled from the original drawing commands and is for reference only.