
Exploring the Mean Value Theorem by MrQuinn (2)
Loading the math board and drawing, please wait…
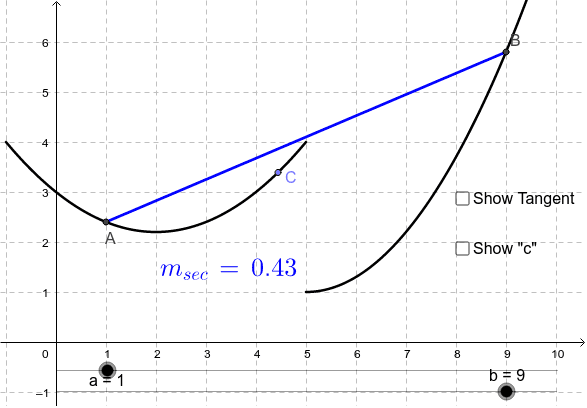
This example demonstrates the Mean Value Theorem by visually representing the relationship between the slopes of a tangent and a secant line on a function graph. Key math concepts include functions, derivatives, tangent slopes, secant slopes, and the Mean Value Theorem itself. It is constructed using GeoGebra commands like Function, If, Point, Tangent, Slope, LaTeX, and Segment. Ideal for high school and above students to understand the geometric interpretation of the Mean Value Theorem in calculus.
GeoGebra Commands & Parameters
Function(0.3 * (x - 5)^(2) + 1, 5, 10) → gFunction(0.2 * (x - 2)^(2) + 2.2, -1, 5) → fIf(x ≤ 5, f, g) → hPoint(h) → CTangent(C, h) → TangentSlope(Tangent) → m_{tan}LaTeX(m_{tan}, true, true) → text2LaTeX(c, true, true) → text3Segment(A, B) → iSlope(i) → m_{sec}LaTeX(m_{sec}, true, true) → text1
AI Drawing Prompt Reference
Draw a function graph to demonstrate the relationship between the slopes of a tangent and a secant line, illustrating the Mean Value Theorem. Plot two functions, one defined on the interval [5,10] and the other on [-1,5], and display the appropriate function based on the x-value. Mark a point on the graph, draw the tangent and secant lines at this point, label their slopes, and display these slope values as text to visually represent the Mean Value Theorem.
The prompt above was compiled from the original drawing commands and is for reference only.