
Exploring Quadratic Functions in Vertex Form
Loading the math board and drawing, please wait…
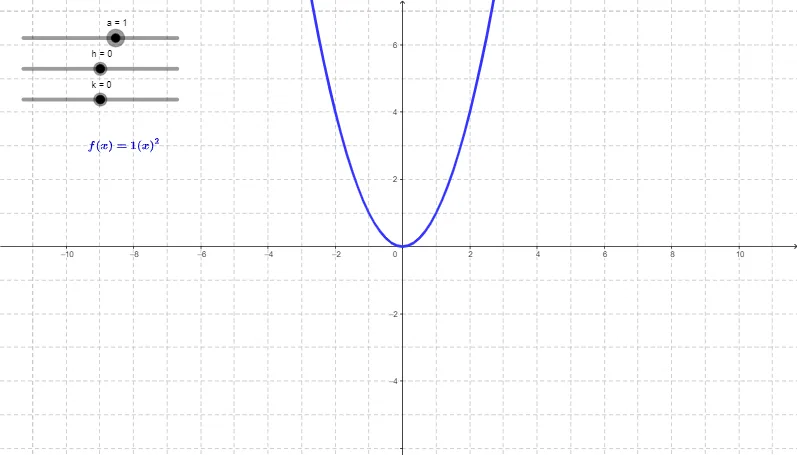
This example demonstrates how to investigate the properties of a quadratic function of the form f(x)=a(x-p)^2+q using GeoGebra. Key mathematical concepts include the vertex, axis of symmetry, direction and width of the parabola, and the effects of parameters a, p, and q on the graph. The construction utilizes GeoGebra commands/objects: a (coefficient slider), h (p substitute for x-coordinate of vertex), k (q substitute for y-coordinate of vertex), c (auxiliary point), L1 (function graph), L2 (axis of symmetry), L21 (vertex label), T1 (text label). Suitable for high school students learning about quadratic function transformations and properties.
GeoGebra Commands & Parameters
Numeric a(1)Numeric h(0)Numeric k(0)y = (a * (x + h)^(2)) + k{"+", "-"}{"-", "+"}Numeric L21(0)
AI Drawing Prompt Reference
Plot a quadratic function in vertex form to show how the parameters affect the graph. Include adjustable numeric values for the coefficient a, and for the vertex substitutes h and k (with h and k settable, for example starting at 0). Draw the function curve defined by y = a(x + h)^2 + k in a coordinate plane. Also include the axis of symmetry as a vertical line corresponding to the vertex’s horizontal position, and add a label at the vertex. Indicate the vertex-form structure with visible “+” and “−” sign choices so the expression y = a(x + h)^2 + k is clear. Build it by first setting a, h, k, then drawing the curve and symmetry axis, and finally placing the vertex label and related text.
The prompt above was compiled from the original drawing commands and is for reference only.