
Exploring Quadratic Equations in Standard Form
Loading the math board and drawing, please wait…
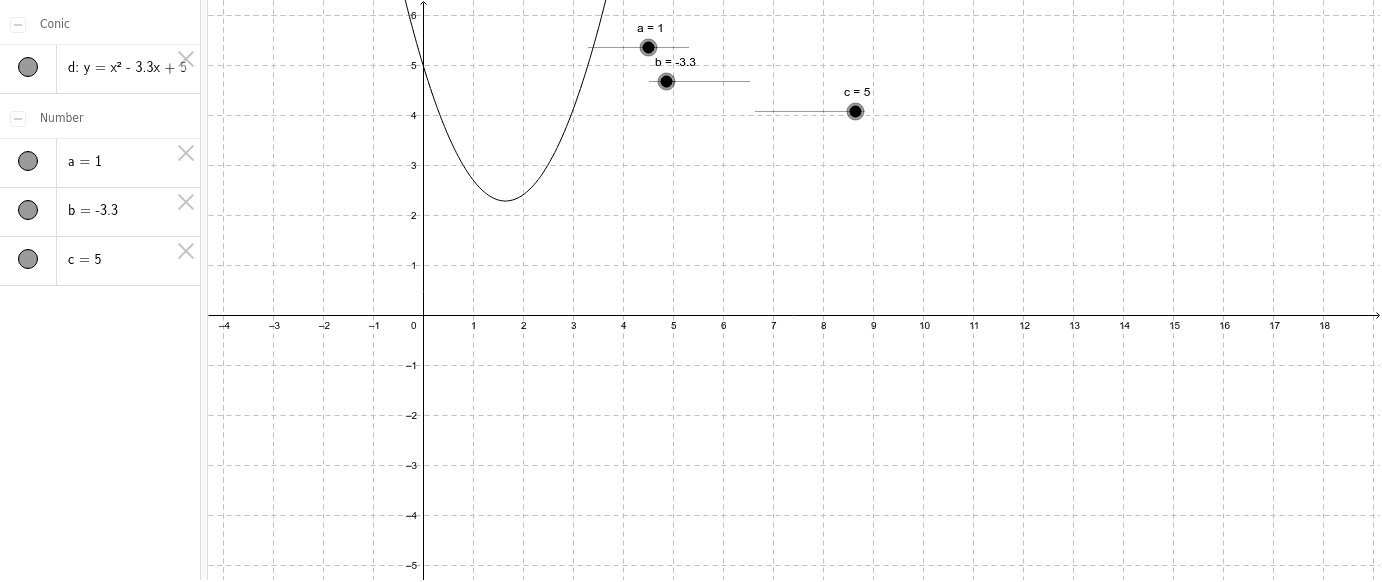
This example demonstrates how to observe the changes in the graph of a quadratic equation y=ax²+bx+c by dynamically adjusting parameters a, b, and c. Key math concepts include the properties of quadratic functions and the impact of parameters on the graph's shape and position. GeoGebra sliders are used to control the values of parameters a, b, and c. Suitable for high school students learning about quadratic functions and their transformations, helping to understand the visual effects of parameter changes on function graphs.
GeoGebra Commands & Parameters
Numeric a(1.0)Numeric b(-3.3)Numeric c(5.0)y = a * x^(2) + b * x + c
AI Drawing Prompt Reference
Create a dynamic graph of a quadratic function where parameters a, b, and c are set to 1.0, -3.3, and 5.0 respectively using sliders, to observe the changes in the graph of y=ax²+bx+c and understand the impact of parameters on the shape and position of the function graph.
The prompt above was compiled from the original drawing commands and is for reference only.