
Exploring Mean and Median in a Dotplot
Loading the math board and drawing, please wait…
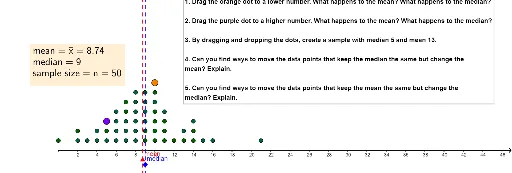
This example demonstrates how to visualize and compare the mean and median in a dotplot. It involves core mathematical concepts such as arithmetic mean, distributions, median line, statistics, and probability. The construction uses GeoGebra commands and objects like mean, Median, stdevp, Point, and Length. Suitable for high school students learning statistics and data analysis.
GeoGebra Commands & Parameters
mean(list2) → B1Median(list2) → B2stdevp(list2) → B3Point(a) → MEANLength(list2) → B4
AI Drawing Prompt Reference
Create a dotplot to visualize the distribution of data points, marking the mean and median with distinct colors or symbols. Also, calculate and display the mean, median, standard deviation, and number of data points, showing the mean as a point, the median as a line, and labeling all statistics on the plot.
The prompt above was compiled from the original drawing commands and is for reference only.