
Exploring Linear Functions
Loading the math board and drawing, please wait…
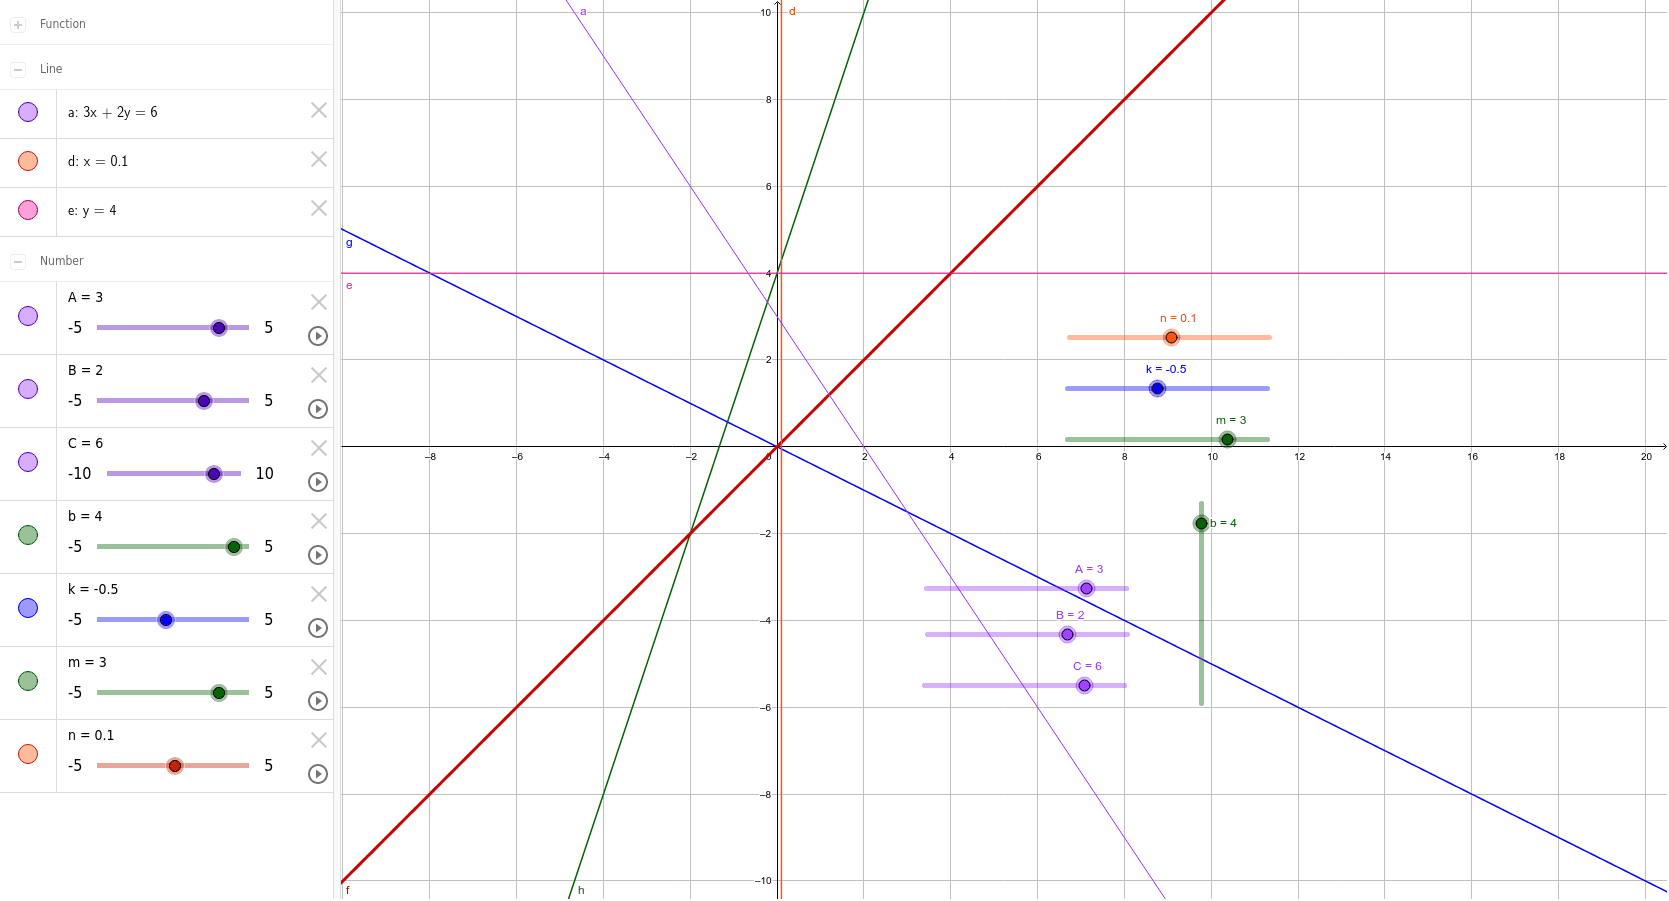
This example demonstrates the graph and properties of linear functions. It involves key mathematical concepts such as the slope and y-intercept of linear functions. By using GeoGebra commands like n, m, b, d, e, k, g, h, f, A, B, C, a, you can dynamically adjust the parameters of the linear function and observe changes in its graph. Suitable for students at the middle school level and above to learn about linear functions.
GeoGebra Commands & Parameters
Numeric n(0.1)Numeric m(3)Numeric b(4)x = ny = bNumeric k(-0.5)g(x) = (k * x)h(x) = (m * x) + bf(x) = xNumeric A(3)Numeric B(2)Numeric C(6)(A * x) + (B * y) = C
AI Drawing Prompt Reference
Draw a linear function graph showing slope and y-intercept, with different slopes to illustrate function changes, include a coordinate grid and geometric constructions like points, lines, and equations for observation and comparison of linear function properties.
The prompt above was compiled from the original drawing commands and is for reference only.