
Exploring Linear Functions: Slope, Intercept, and Graph Transformations
Loading the math board and drawing, please wait…
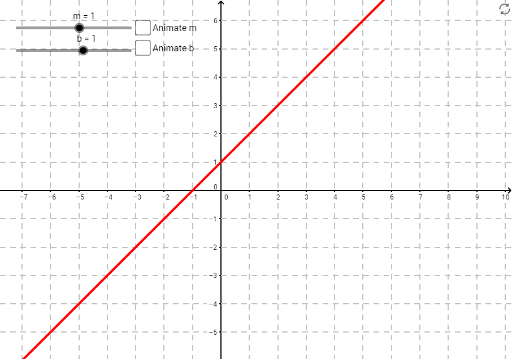
① This GeoGebra example dynamically demonstrates how the slope m and y-intercept b of a linear function y = m·x + b affect the line's steepness and position, while also incorporating elements like the unit circle and hyperbola to show connections between different function types. ② Core mathematical concepts include linear functions, slope, intercept, function graphs, unit circle, hyperbola, roots, and frequency distribution, emphasizing function transformations and geometric visualization. ③ Construction highlights: objects m, b, f, a, and c are created; m and b serve as adjustable sliders, f is the linear function expression, and a and c likely support auxiliary graphs (e.g., unit circle or hyperbola). Dragging the sliders updates the graph in real time. ④ Suitable for middle school to high school students learning function basics, and for teachers demonstrating how parameters affect graphs, fostering a visual and algebraic connection.
GeoGebra Commands & Parameters
Numeric m(1)Numeric b(1)y = (m * x) + bBoolean a(false)Boolean c(false)
AI Drawing Prompt Reference
Draw a Cartesian coordinate plane with a straight line whose equation is slope times x plus intercept. Two draggable sliders control the slope and intercept, and dragging them updates the line's steepness and vertical position in real time. Also include a unit circle and a hyperbola as auxiliary curves to illustrate connections between different function types. The overall graphic emphasizes how parameter changes affect function graphs, suitable for classroom demonstration.
The prompt above was compiled from the original drawing commands and is for reference only.