
Exploring Inequalities: Dynamic Parameters and Geometric Construction
Loading the math board and drawing, please wait…
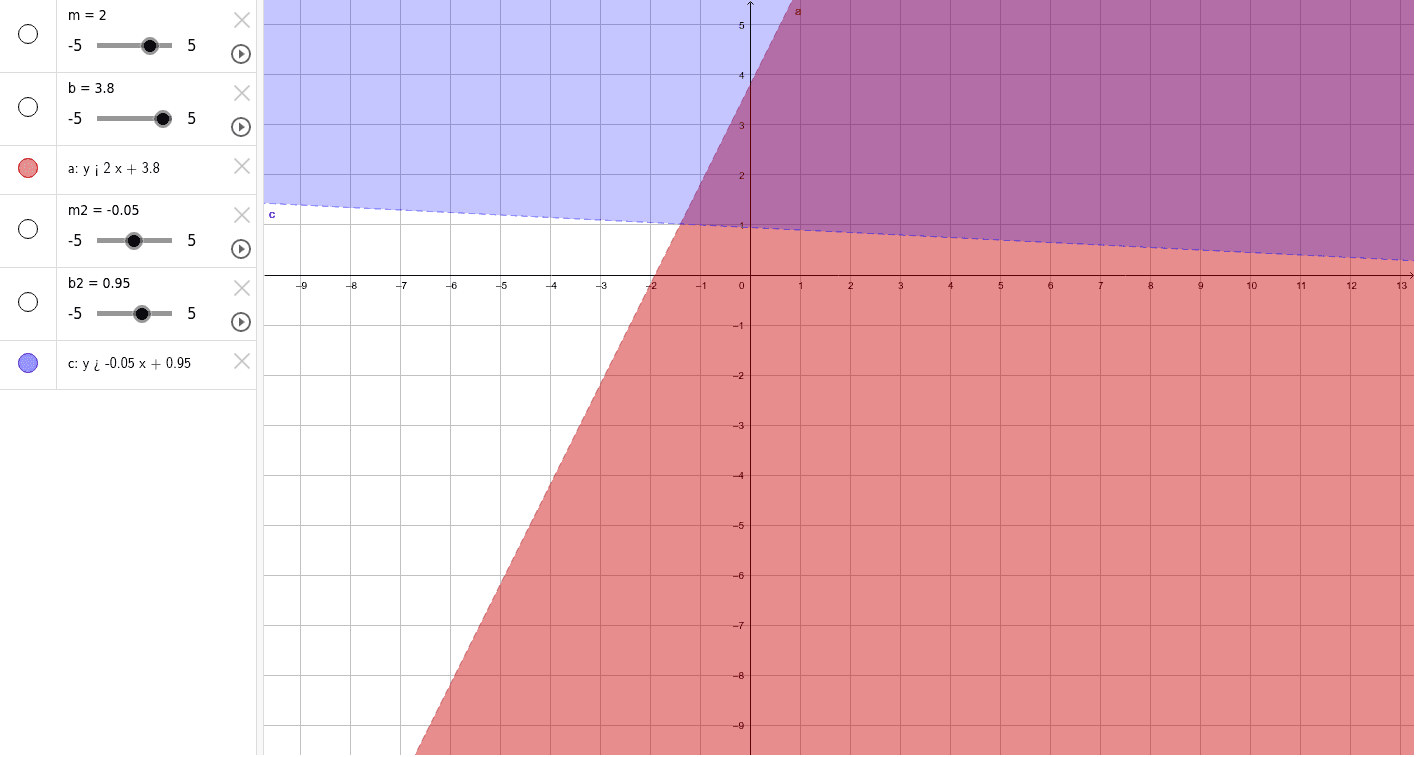
① This example demonstrates how inequality regions change dynamically as parameters m, b, a, m2, b2, and c are adjusted, providing a visual exploration of solution sets. ② Core mathematical concepts include linear and quadratic inequalities, function graphs, region shading, and the effect of parameter variation on solution sets. ③ Construction highlights: using GeoGebra objects m, b, a, m2, b2, c as adjustable sliders, constructing lines or curves and shading corresponding regions to visualize inequality solutions; involves sliders, function graphing, and region filling. ④ Suitable for middle and high school mathematics, helping students understand the geometric meaning of inequality solution sets, parameter influence on graphs, and connections between functions and inequalities; also useful for exploring symmetry, dilation, and related transformations.
GeoGebra Commands & Parameters
Numeric m(2)Numeric b(3.8)a(x, y) = y < (m * x) + bNumeric m2(-0.05)Numeric b2(0.95)c(x, y) = y > (m2 * x) + b2