
Exploring Exponential Functions: Changing a and b
Loading the math board and drawing, please wait…
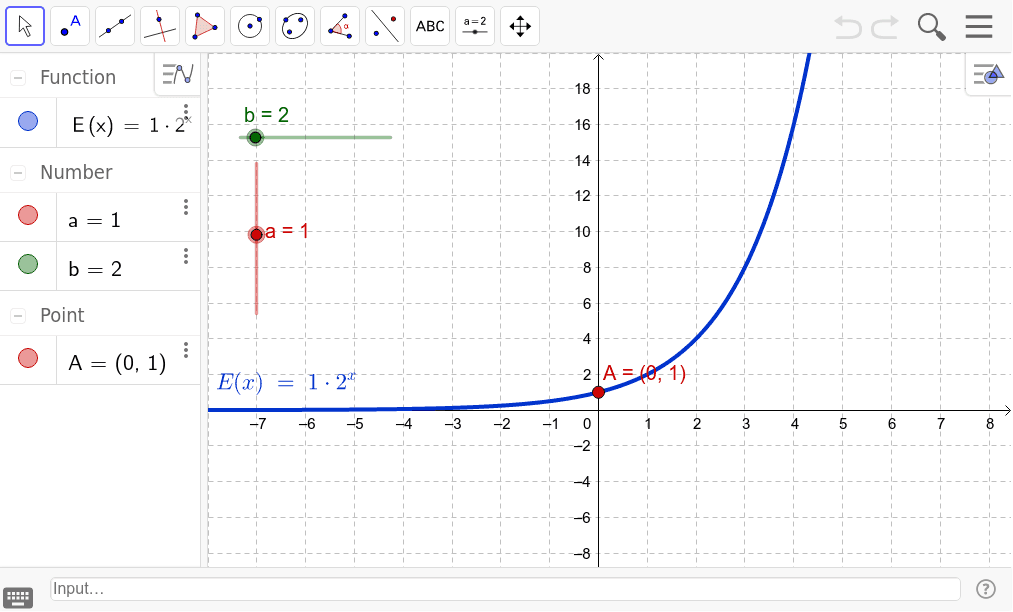
This example demonstrates the effect of changing parameters a and b in the exponential function y = a*b^x on its graph. The key mathematical concepts involve understanding how parameters influence the function's shape and behavior. Construction uses GeoGebra commands like Intersect with objects a, b, E, and A. Suitable for middle or high school mathematics education to grasp exponential function properties and parameter effects.
GeoGebra Commands & Parameters
Intersect(E, yAxis, (0, 1)) → A
AI Drawing Prompt Reference
Draw a coordinate plane with an exponential curve defined by y = a times b to the power of x. The curve starts low on the left and rises to the right, crossing the y-axis at the point (0,1), which is marked with a distinct dot. Include two adjustable parameters, a and b, that affect the curve's steepness and vertical position. The intersection with the y-axis remains fixed at (0,1), while changes in parameters alter the curve's shape. The graph illustrates how parameters influence the exponential function, suitable for educational demonstration.
The prompt above was compiled from the original drawing commands and is for reference only.