
Exploring Definite Integral as Limit of Sum
Loading the math board and drawing, please wait…
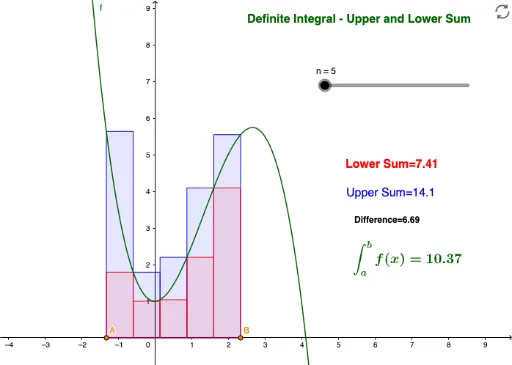
This example demonstrates how to represent a definite integral as the limit of a sum using GeoGebra. It involves core mathematical concepts such as definite integral, limit, and function. Construction highlights include using commands and objects like Point, UpperSum, LowerSum, Integral to build function graphs, sum points, and integral regions. Suitable for high school or early university students learning calculus.
GeoGebra Commands & Parameters
Point(xAxis) → APoint(xAxis) → BUpperSum(f, x(A), x(B), n) → aLowerSum(f, x(A), x(B), n) → bIntegral(f, x(A), x(B)) → c
AI Drawing Prompt Reference
Draw a function graph and display two sum areas below it, one obtained by upper rectangles and the other by lower rectangles, while marking the definite integral area over the interval between them to illustrate the concept of definite integral as the limit of a sum.
The prompt above was compiled from the original drawing commands and is for reference only.