
Exploring Cubic Graphs and x-Intercepts
Loading the math board and drawing, please wait…
In collections
Maths and Statistics Support
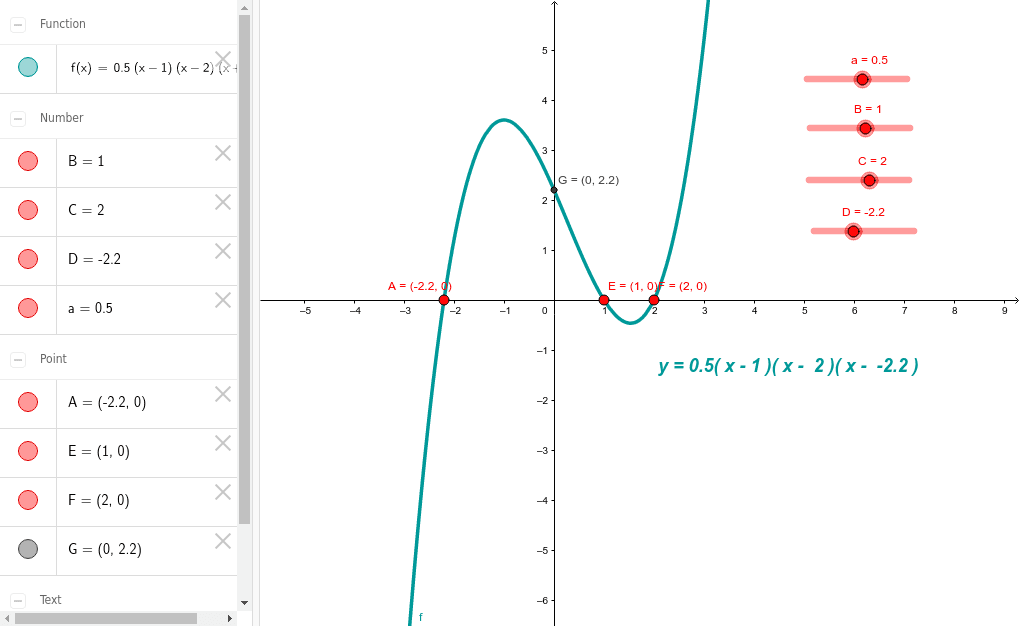
①This example dynamically demonstrates the link between the equation of a cubic function and its x-intercepts (roots), helping students visualize how algebraic expressions correspond to geometric graph features. ②Core mathematical concepts include cubic functions, polynomial roots, intersections with the x-axis, and the relationship between factorization and graph shape. ③Construction highlights: using GeoGebra's Intersect command to find points A, B, C where the function f meets the x-axis, and creating additional points D, E, F, G and text1 to label and display coordinates, allowing interactive exploration of different cubic equations. ④Suitable for high school students learning functions and equations, as well as introductory calculus courses, serving as a visual teaching aid to bridge symbolic algebra and graphical understanding.
GeoGebra Commands & Parameters
Intersect(f, xAxis) → A, E, FIntersect(f, yAxis, 1) → G
AI Drawing Prompt Reference
Draw a cubic function and find its intersections with the x-axis at points A, E, and F. Then, locate the intersection with the y-axis at point G. Adjust the function expression to observe changes in the intersection points and understand the relationship between the roots of the cubic function and its graph.
The prompt above was compiled from the original drawing commands and is for reference only.