
Experimental Probability Spinner
Loading the math board and drawing, please wait…
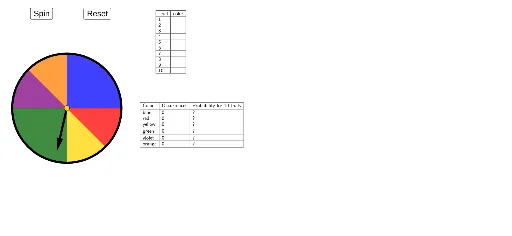
This example demonstrates experimental probability using a dynamic spinner, covering core concepts like probability calculation, confidence intervals, multiplication principles, polygons, polynomial functions, and tangent functions. It utilizes commands such as CountIf, Circle, Rotate, Vector, Line, OrthogonalLine, Intersect, CircleSector, Midpoint, IsInRegion, Sum, Element, and TableText in GeoGebra for construction. Suitable for high school probability and function graphing education.
GeoGebra Commands & Parameters
CountIf(x ≟ "orange", B2:B11) → E7CountIf(x ≟ "violet", B2:B11) → E6CountIf(x ≟ "green", B2:B11) → E5CountIf(x ≟ "yellow", B2:B11) → E4CountIf(x ≟ "red", B2:B11) → E3CountIf(x ≟ "blue", B2:B11) → E2Circle(A, B) → cRotate(S0, (-(a°)), A) → CVector(A, C) → uLine(B, A) → bOrthogonalLine(A, b) → eIntersect(c, e) → D, ECircleSector(A, E, B) → fIntersect(c, b) → F, GMidpoint(G, E) → HLine(A, H) → gIntersect(c, g) → I, JCircleSector(A, J, E) → hCircleSector(A, G, J) → kCircleSector(A, D, G) → pCircleSector(A, I, D) → qCircleSector(A, B, I) → rIsInRegion(C, f) → iIsInRegion(C, h) → jSum(Sequence[(IsInRegion[C, Element[liste2, k]] * k), k, 1, 6]) → mElement(liste1, m) → texte1TableText({{A1, B1}, {A2, B2}, {A3, B3}, {A4, B4}, {A5, B5}, {A6, B6}, {A7, B7}, {A8, B8}, {A9, B9}, {A10, B10}, {A11, B11}}, "|_") → text1TableText({{D1, E1, F1}, {D2, E2, F2}, {D3, E3, F3}, {D4, E4, F4}, {D5, E5, F5}, {D6, E6, F6}, {D7, E7, F7}}, "|_") → text2
AI Drawing Prompt Reference
Create a dynamic spinner with five color sectors: orange, violet, green, yellow, and red. Each sector represents different probabilities. Use these colors and their counts to calculate experimental probability. The center of the spinner is point A, and a circle c is drawn around A. Rotate point S0 to get point C, draw vector u through points A and C, draw line b through points B and A, and draw the perpendicular line e through point A and b. Use these to construct sectors f, h, k, p, q, and r. Based on the color sector counts, determine the size of each color sector on the spinner.
The prompt above was compiled from the original drawing commands and is for reference only.