
Exercise 8: Random Functions and Probability
Loading the math board and drawing, please wait…
In collections
LINEAR FUNCTIONS
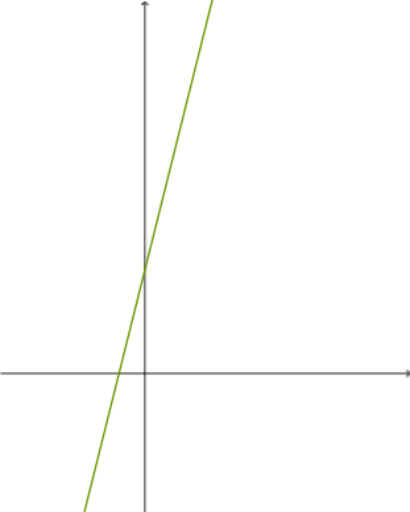
This example demonstrates the concepts of random functions and probability. By using random number generators and random elements, users can explore the random nature of functions. Core mathematical concepts include probability and random variables. The construction summary uses GeoGebra commands such as Random, RandomElement, Textfield, and TableText. Suitable for high school mathematics education and students learning probability and statistics.
GeoGebra Commands & Parameters
Random(-10, 10) → aRandomElement({-5, -4, -3, -2, -1, 1, 2, 3, 4, 5}) → a_1RandomElement({-5, -4, -3, -2, -1, 1, 2, 3, 4, 5}) → cRandom(-10, 10) → bTextfield(h) → InputBox1Random(-10, 10) → b_1RandomElement({-5, -4, -3, -2, -1, 1, 2, 3, 4, 5}) → c_1Random(-10, 10) → d_1Textfield(m) → InputBox2Textfield(f) → InputBox4Random(-10, 10) → d_2TableText({{A1_1, B_1, C_1, D_1}, {-3, g(-3), h(-3), f(-3)}, {-2, g(-2), h(-2), f(-2)}, {-1, g(-1), h(-1), f(-1)}, {0, g(0), h(0), f(0)}, {1, g(1), h(1), f(1)}, {2, g(2), h(2), f(2)}, {3, g(3), h(3), f(3)}, {1, e, l, k}}, "|_r") → text3_1
AI Drawing Prompt Reference
Visualize the concepts of random functions and probability with a graph showing multiple randomly generated values and functions, presented in a table format to display random outputs of functions at different inputs, emphasizing the relationship between probability and random variables, starting with random value generation, then constructing a function table incorporating these values, and finally integrating to show the overall display.
The prompt above was compiled from the original drawing commands and is for reference only.