
Evaluating Functions Graphically
Loading the math board and drawing, please wait…
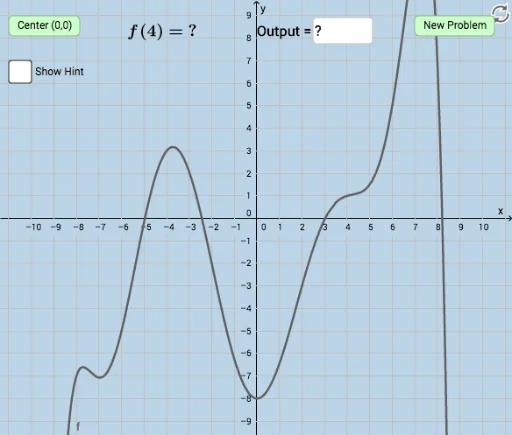
Evaluate a function at a random input value by inspecting its graph: Interactive Quiz (with feedback). This example covers function graphs, intersections, frequency distributions, and other key math concepts. It uses GeoGebra commands like Random, RandomElement, and FitPoly for construction. Suitable for high school math education and learning.
GeoGebra Commands & Parameters
Random(-8, 8) → aRandom(-8, 8) → bRandom(-8, 8) → cRandom(-8, 8) → dRandom(-8, 8) → eRandom(-8, 8) → fRandom(-8, 8) → gRandom(-8, 8) → hRandom(-8, 8) → iRandomElement(list) → nFitPoly({A, B, C, D, E, F, G, H, I}, 8) → pTextfield(k) → InputBox1