
Euler's Formula Visualization (θ=ωt)
Loading the math board and drawing, please wait…
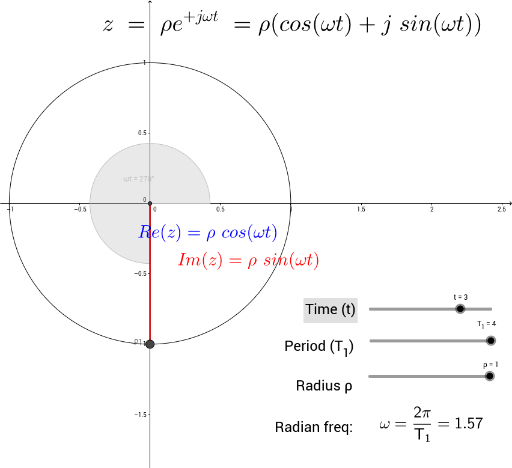
① This example demonstrates the geometric meaning of Euler's formula e^(iθ)=cosθ+i·sinθ when θ=ωt, showing a point rotating uniformly on the unit circle as time progresses. ② Core math concepts include Euler's formula, complex exponential functions, trigonometric functions (sine and cosine), angular velocity and phase, unit circle, and vector rotation. ③ Construction uses GeoGebra commands such as Intersect, AttachCopyToView, Vector, Polygon, Angle, Segment, and Point, with sliders for t and ω to animate the motion, plus auxiliary objects like triangles, text labels, and coordinate axes for clarity. ④ Ideal for high school to undergraduate mathematics education, particularly for teaching complex numbers, trigonometric identities, and simple harmonic motion in physics, as well as connecting exponential and trigonometric functions in calculus.
GeoGebra Commands & Parameters
Intersect(xAxis, yAxis) → AIntersect(c, xAxis, 2) → BAttachCopyToView(PolyLine[(-0.26957544366672426, 1.055679412366869), (NaN, NaN), (-0.6124992426298832, 1.1406238396329724), true], 1, (-1.2448633122775434, -1.3668098096664527), (1.397852202667902, 1.2821978850764781), (0, 842), (840, 0)) → stroke1Intersect(q, yAxis, (0, 0)) → EVector(E, F) → timeAxisOnlyPolygon(M, N, O, P) → poly1, f, i, j, kAngle(B, A, P1) → ωtSegment(P1, C) → ycoordSegment(A, C) → xcoordPoint(xcoord) → GSegment(C, G) → lSegment(A, P1) → magnitude