
Estimating Slope at a Point on a Function
Loading the math board and drawing, please wait…
In collections
Calculus C01_Limits&Their Properties
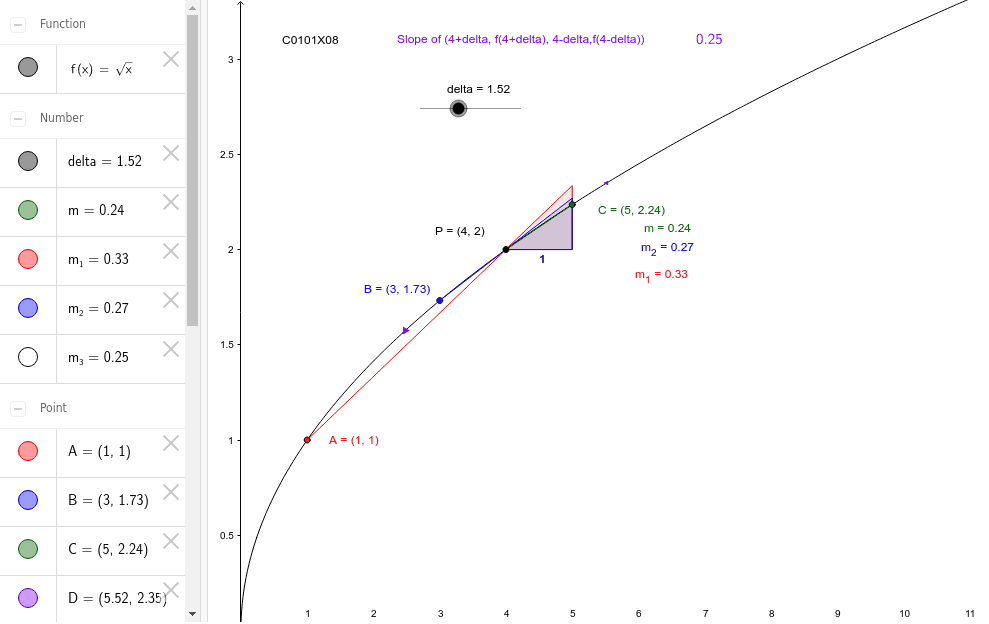
This example demonstrates how to estimate the slope of a tangent line at a point on a function graph. Key math concepts include functions, tangents, slopes, and analytical geometry. It is constructed using GeoGebra commands like Segment, Slope, and LaTeX, with objects such as function f, point P, and variables a, b, c, m. Suitable for high school and above students learning calculus, function graph analysis, and geometric constructions.
GeoGebra Commands & Parameters
Segment(P, A) → aSegment(P, B) → bSegment(P, C) → cSlope(c) → mSlope(a) → m_1Slope(b) → m_2Segment(G, D) → dSlope(d) → m_3LaTeX(m_3) → text1
AI Drawing Prompt Reference
Draw a function graph and mark a point P on it. From point P, draw line segments to points on either side of the graph and calculate their slopes. Also, draw a horizontal line segment from P to a point above the graph and calculate its slope. Finally, display the slope of the rightmost line segment as a formula to show how to estimate the slope of the tangent line at point P on the function.
The prompt above was compiled from the original drawing commands and is for reference only.