
Estimate Class Average Hand Size Using Dot Plot
Loading the math board and drawing, please wait…
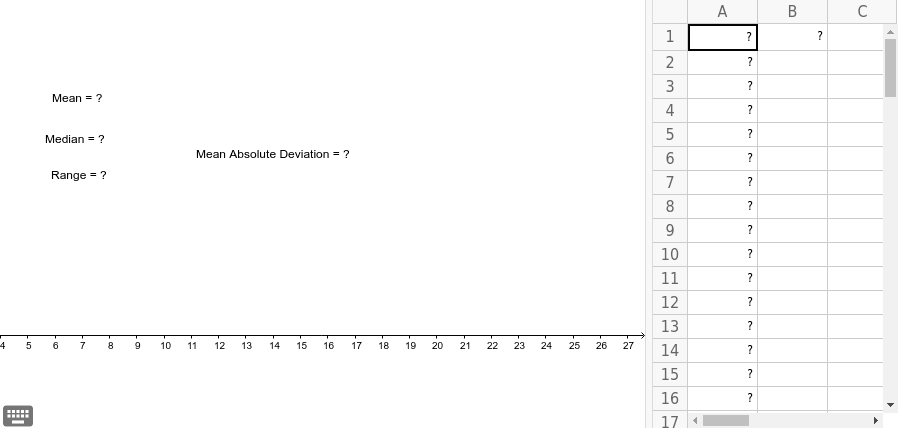
This example uses a dot plot to estimate the class average hand size. It involves the statistical concept of a dot plot, which visually represents sample data. The construction summary mentions the use of commands like DotPlot, Mean, Median, and objects such as A1 to A20. Suitable for 6th grade students to measure and analyze hand sizes.
GeoGebra Commands & Parameters
DotPlot(A1:A20) → list1Mean(A1:A20) → B1Median(A1:A20) → aMedian(A1:A20) → bMedian(A1:A20) → cMedian(A1:A20) → C1Mean(F1:F20) → G1
AI Drawing Prompt Reference
Create a dot plot to estimate the class average hand size, showing data distribution from the first to the second group. Calculate and mark the mean of the first group and the median of the first group, then calculate and mark the mean of the second group. The dot plot and calculation results together form a statistical chart suitable for displaying and analyzing hand size data.
The prompt above was compiled from the original drawing commands and is for reference only.