
Equivalent Fractions Visualization by John Golden
Loading the math board and drawing, please wait…
In collections
Primary School Mathematics Collection
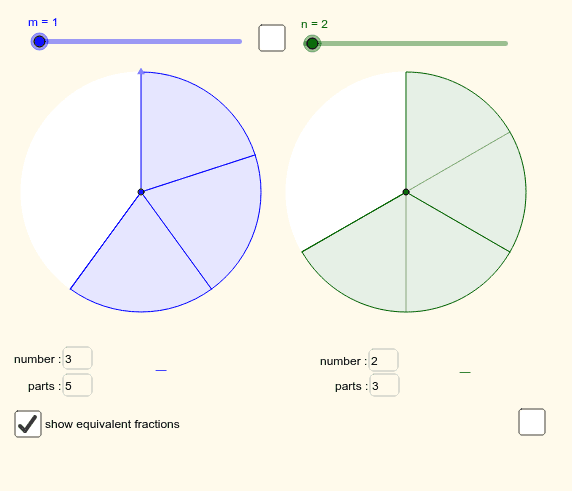
This example demonstrates the equivalence of two fractions through a pie chart visualization. It involves core math concepts like fractions, percentages, and geometric representation. Constructed using commands such as Point, Circle, Rotate, Sequence, CircleSector, and Textfield, it is suitable for middle school mathematics education to visually understand the fundamental properties and transformations of fractions.
GeoGebra Commands & Parameters
Point(y = y(A)) → BPoint(x = x(A)) → A'Circle(A, A') → cCircle(B, B') → dRotate(A', (((-(m1 / m2)) * 360))°, A) → A''Rotate(B', (((-(n1 / n2)) * 360))°, B) → B''Sequence(Segment[A, Rotate[A', ((i * 360) * ° / ka), A]], i, 1, ka) → list1CircleSector(A, A'', A') → eCircleSector(B, B'', B') → fTextfield(m1) → inputBox1Textfield(m2) → inputBox2Textfield(n1) → inputBox3Textfield(n2) → inputBox4Sequence(Segment[B, Rotate[B', (((-i) * 360) * ° / kb), B]], i, 1, (n * n1)) → list4Sequence(Segment[B, Rotate[B', ((i * 360) * ° / kb), B]], i, 1, kb) → list2Sequence(Segment[A, Rotate[A', (((-i) * 360) * ° / ka), A]], i, 1, (m * m1)) → list3Sequence(Segment[A, Rotate[A', (((-i) * 360) * ° / m2), A]], i, 1, m1) → list5Sequence(Segment[B, Rotate[B', (((-i) * 360) * ° / n2), B]], i, 1, n1) → list6
AI Drawing Prompt Reference
Visualize the equivalence of two fractions using pie charts, with two concentric circles representing the whole, divided into sectors for fractions m1/m2 and n1/n2, each colored differently and labeled with their respective fractions to demonstrate the fundamental properties and transformations of fractions.
The prompt above was compiled from the original drawing commands and is for reference only.