
Equations to Describe Graphs
Loading the math board and drawing, please wait…
In collections
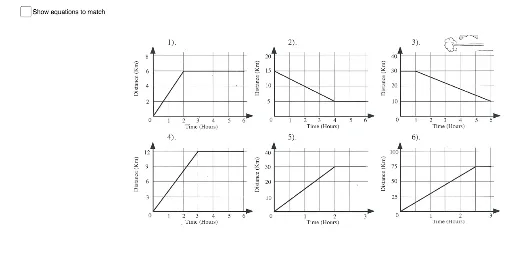
Equations from Graphs
This example demonstrates how to describe graphs using equations. It covers key concepts such as equations, scatter plots, and curve sketching. Using GeoGebra commands like text1_3, a, A, B, pic1, etc., various curves can be constructed. Suitable for high school mathematics education and learning.
GeoGebra Commands & Parameters
Boolean a(false)Point A(2.1713342304580348, -3.7310392600285542)Point B(21.357774264908443, -3.8184395291659636)Boolean b(false)