
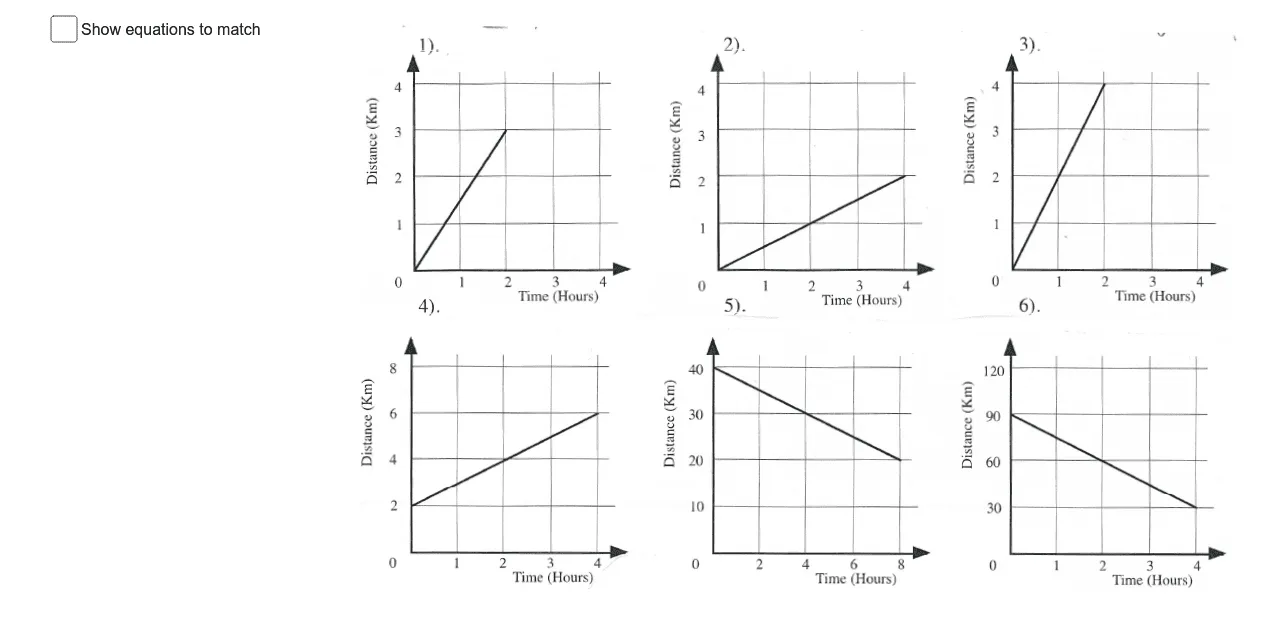
Equations to Describe Graphs A
Loading the math board and drawing, please wait…
In collections
Equations from Graphs
This example demonstrates how to describe and plot geometric graphs using equations. Core math concepts include equations, logic, set theory, sequences and series, right triangles, and multiplication. Construction highlights the use of GeoGebra commands/objects like text1, text1_1, text1_2, etc., for annotations and drawings. Suitable for high school students learning analytical geometry and function graphing.
GeoGebra Commands & Parameters
Boolean a(false)Point O(2.899669806603116, -5.666330933785483)Point P(21.06644003445041, -5.836969554482328)
AI Drawing Prompt Reference
Draw a coordinate system with the origin at (2.899669806603116, -5.666330933785483) and another point at (21.06644003445041, -5.836969554482328), labeling their coordinates.
The prompt above was compiled from the original drawing commands and is for reference only.