
Epsilon-Delta Limit Definition Demo
Loading the math board and drawing, please wait…
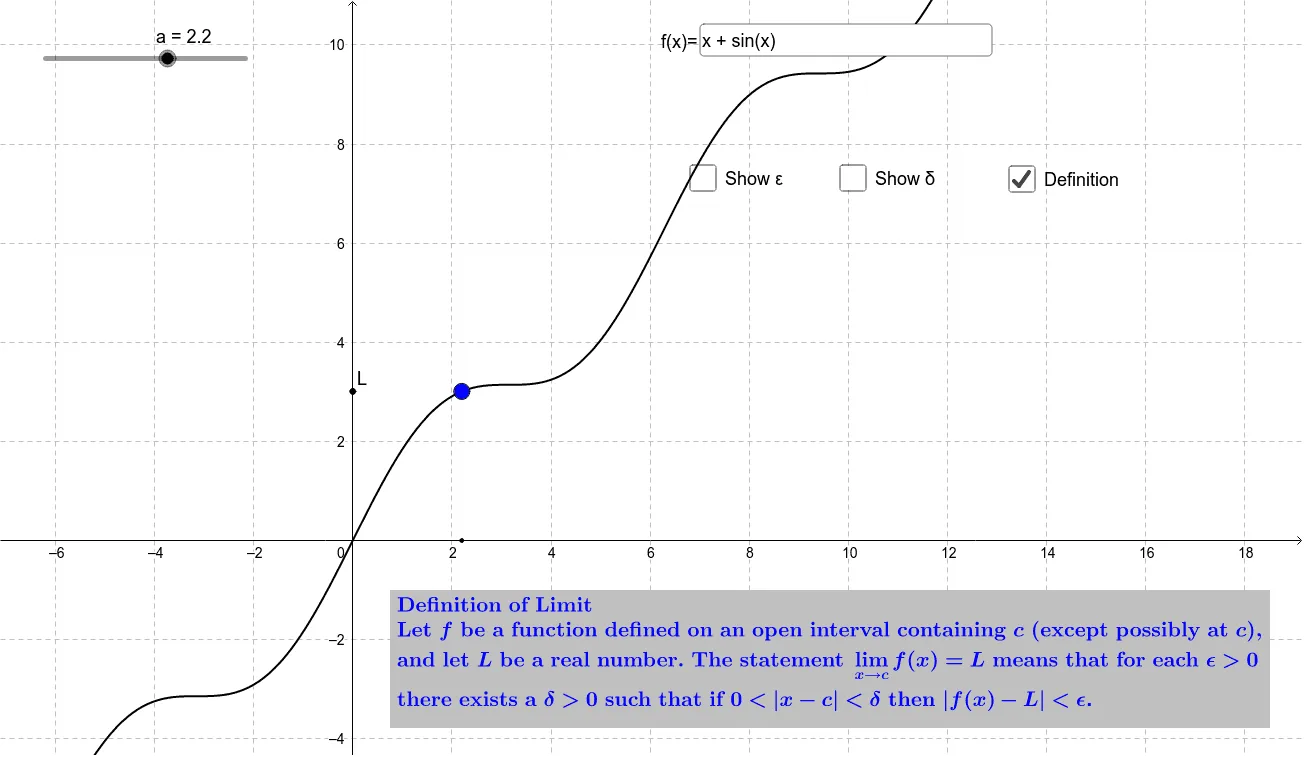
This example visually demonstrates the epsilon-delta definition of a limit through dynamic geometry, illustrating how function values approach a limit within a given range. Key math concepts include limits, epsilon-delta definition, function graphs, and symmetry. GeoGebra commands like IntegralBetween, Segment, and Textfield are used to construct the visualization, with sliders showing ε and δ changes. Suitable for high school and above learners to grasp limit theory and geometric intuition.
GeoGebra Commands & Parameters
IntegralBetween(f(a + δ), f(a - δ), a - δ, a + δ) → cSegment(B, J) → dSegment(C, K) → eSegment(G, K) → gSegment(F, M) → hTextfield(f) → InputBox1
AI Drawing Prompt Reference
Draw a graphic demonstrating the limit definition. The graphic should include a function curve, a center point, an interval, and sliders for ε and δ. The curve approaches a value near the center point, and the interval shows the function's variation within it. The sliders can adjust ε and δ to observe whether function values fall within the interval. The graphic should clearly show how function values approach the limit point as the interval shrinks.
The prompt above was compiled from the original drawing commands and is for reference only.